Oxygen Dissociation Curve Simulator
Shift the oxygen haemoglobin curve with pH, carbon dioxide, temperature and 2,3-BPG, and watch P50 and tissue oxygen delivery respond to each one.
Simulator
- P50 The partial pressure at which haemoglobin is half saturated. Higher means lower affinity, which is a right shift.
- 26.8 mmHg
- Shift Measured against the standard curve at pH 7.4, pCO₂ 40 mmHg, 37 °C and 2,3-BPG 5 mmol/L.
- None, standard curve
- Arterial saturation Saturation at 100 mmHg, where blood leaves the lung. About 97 percent normally.
- 97.2%
- Venous saturation Saturation at 40 mmHg, where blood leaves a resting tissue. About 75 percent normally.
- 74.7%
- A to V difference The fraction of its load the blood gives up in one pass. A right shift widens it.
- 22.5%
- Arterial O₂ content 1.34 × haemoglobin × saturation, plus 0.003 × pO₂ dissolved. This is the number anaemia changes and saturation does not.
- 19.8 mL/dL
- Oxygen delivered Arterial content minus venous content: what one decilitre of blood hands to the tissue per pass.
- 4.71 mL/dL
- Haemoglobin, current conditions (%)
- Haemoglobin, standard curve (%)
- Myoglobin, n = 1 (%)
- Oxygen content (mL/dL)
Citing this tool
Last updated . Add the date you accessed it as well, which a citation of a page that can change asks for. If a specific result matters, cite the permalink from the tool’s share row instead of this page: it reproduces the exact parameters.
The equation
Hill (1910), with Severinghaus (1979) standard curve
Why the curve is sigmoid and myoglobin’s is not
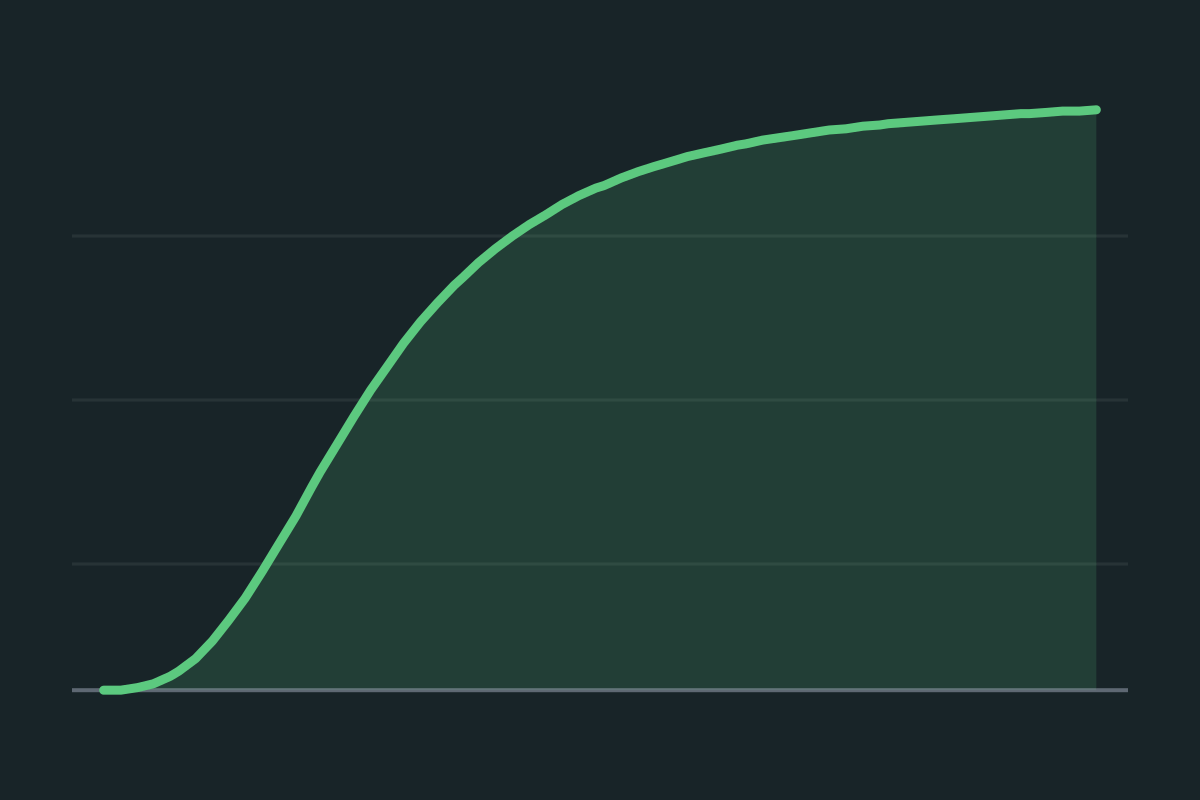
Haemoglobin has four binding sites, and they talk to each other. Each oxygen that binds pulls the protein a little further from its tense, low-affinity shape towards its relaxed, high-affinity one, so the second oxygen binds more readily than the first and the fourth more readily than the third. That is cooperative binding, and it is what makes the middle of the curve steep: a small fall in partial pressure there releases a lot of oxygen.
Myoglobin has one site and nothing to cooperate with, so its curve is a plain rectangular hyperbola with its steepest slope at the origin. Both curves on the plot come from the same equation with the same code; the exponent, 2.7 against 1, is the only thing that decides the shape, while myoglobin’s far lower P50, 2.6 mmHg against 26.8 mmHg under standard conditions, only rescales its curve along the pressure axis. That is the cleanest evidence available that the S shape comes from the interaction between sites rather than from anything about oxygen or about haem chemistry.
Notice also where myoglobin sits: far to the left, still above 90 percent saturated at the 40 mmHg where haemoglobin has already handed over a quarter of its load. That difference in affinity is what lets muscle pull oxygen out of blood at all.
The flat top, and why pulse oximetry is a late warning
Between arterial pressures of 100 and 60 mmHg the curve barely moves. Saturation goes from about 97 percent to about 90 percent while the partial pressure falls by nearly half. A patient can lose a great deal of respiratory reserve with almost no change in the number on the oximeter.
Below 60 mmHg the curve steepens and saturation then falls quickly, which is why 60 mmHg gets treated as a threshold rather than as a point on a gradual slope. The practical consequence is that a saturation drifting from 98 to 94 percent is a much larger event than it looks, and a normal saturation is not evidence of a normal partial pressure.
What a right shift does
A right shift means lower affinity, so P50 rises: haemoglobin needs a higher pressure to reach any given saturation. Less oxygen is picked up in the lung and more is released in the tissue. Because the lung sits on the flat part of the curve and the tissue sits on the steep part, the loss at the top is small and the gain at the bottom is not, so the net effect at these pressures is more oxygen delivered. Shift the curve right here and watch the delivery readout rise while arterial saturation gives up only a point or two.
All four of the things that shift it right are signals of tissue working hard. Acidosis from lactate, a raised carbon dioxide from burning fuel, local warmth from the same, and raised 2,3-BPG from days of anaemia or altitude. The shift is not a curiosity; it is a mechanism that delivers oxygen where and when the demand is.
The Bohr effect is mostly pH, with carbon dioxide acting separately as well
Most of the effect is protons. They bind to haemoglobin and stabilise its low-affinity form, which is why the pH slider moves this curve several times as far as the carbon dioxide slider does. On top of that, carbon dioxide has its own direct action: it forms carbamino compounds with the terminal amino groups of the globin chains, which shifts the curve independently of any pH change.
In a body the two always travel together, so they are usually taught as one effect with a single coefficient. This page separates them so you can see the sizes. Hold pH at 7.4 and take pCO₂ from 40 to 80 mmHg: the curve moves, but hardly. Then drop pH to 7.1, roughly what that much carbon dioxide would do acutely, and the shift is several times larger. The direct carbon dioxide term is real and it is the smaller half by a wide margin.
Why stored blood and fetal haemoglobin sit to the left
2,3-BPG binds in the central cavity of deoxyhaemoglobin and holds it in the low-affinity state. Take it away and the curve moves left: the blood binds oxygen beautifully in the lung and is reluctant to give it up anywhere else.
That is what happens in stored blood, where 2,3-BPG falls over days. Set the slider to zero and P50 drops to about 19 mmHg. Freshly transfused blood is therefore worse at unloading oxygen than its haemoglobin concentration suggests, and it takes a day or so in the circulation to regenerate.
Fetal haemoglobin uses the same mechanism deliberately. Its gamma chains bind 2,3-BPG weakly, so it sits left of adult haemoglobin, which is exactly what a fetus needs: at the shared pressures in the placenta, the leftward curve takes oxygen from the maternal circulation.
Anaemia does not shift the curve at all, and halves the oxygen
This is the most useful thing on the page. Take the haemoglobin slider from 15 to 7.5 g/dL and watch carefully: the curve does not move, P50 does not move, arterial saturation stays at about 97 percent, venous saturation stays at about 75 percent, and the arteriovenous difference is unchanged. Every number a pulse oximeter can report is identical.
The content readout halves, from about 20 to about 10 mL per dL, and so does the oxygen handed to the tissue. Saturation is a percentage of whatever haemoglobin happens to be there, so it cannot tell you how much oxygen that is. Content can:
content = 1.34 × Hb × saturation + 0.003 × pO₂
The second term is the oxygen dissolved in plasma, and its size is the other half of the lesson. At an arterial pressure of 100 mmHg it contributes about 0.3 mL per dL against roughly 20 for the bound fraction, under two percent of the total. That is why anaemia cannot be breathed away: raising the partial pressure only adds to the term that barely counts. A saturation of 100 percent at a haemoglobin of 7 carries less oxygen than a saturation of 85 percent at a haemoglobin of 15.
Where the numbers come from
The curve is the Hill equation with a Hill coefficient of 2.7, which is Roughton’s fit to normal human whole blood and is reliable over roughly 20 to 98 percent saturation. The standard P50 is 26.8 mmHg, the value fitted alongside that exponent. At those settings the curve returns 97.2 percent at 100 mmHg and 74.7 percent at 40 mmHg, which are the arterial and venous figures every textbook quotes, so nothing here has been tuned to make them come out.
The shift is applied to P50 in log space, since a change in affinity slides the whole curve along a logarithmic pressure axis without changing its shape. The pH, carbon dioxide and temperature coefficients are Kelman’s correction from Severinghaus’s blood gas calculator: 0.40 per pH unit, 0.06 per tenfold change in pCO₂, and 0.024 per degree Celsius. The 2,3-BPG coefficient is the weakest link and is taken from the Siggaard-Andersen model, converted to the same log base; published values for it disagree by roughly a factor of two, and the source file says so rather than presenting one as settled.
What this model leaves out
The Hill equation is a curve fit, not a mechanism. An exponent of 2.7 is not a number of binding sites, and haemoglobin does not bind 2.7 oxygens. There are four sites and four sequential binding steps, each with its own constant, which is what the Adair equation describes. The Hill exponent is a summary of how cooperative the whole process is, and it is least accurate below about 20 percent saturation, a region living blood does not visit.
No carbon monoxide. This is the important omission. Carbon monoxide does two separate things: it occupies binding sites, and it shifts the remaining sites left. The second is why it is so dangerous, and it changes the shape of the curve rather than sliding it, so it cannot be represented as a change in P50 at all. Modelling it as a shift would be worse than leaving it out.
No methaemoglobin or other dyshaemoglobins. Ferric haem cannot carry oxygen and also left-shifts what remains, so methaemoglobinaemia lowers content while a pulse oximeter reads a falsely reassuring number near 85 percent regardless of the truth.
One curve for one haemoglobin. A single Hill coefficient cannot represent a mixture, so a patient with sickle haemoglobin, thalassaemia, or a fetal and adult mix has a composite curve this cannot draw. Base excess is also omitted, on the grounds that the pH slider already carries the acid base state a reader is reasoning about.
Common mistakes
- Reading a right shift as bad. It reduces uptake in the lung and increases release in the tissue, and at physiological pressures the second effect wins. A right shift during exercise is the body working correctly.
- Treating saturation as oxygen delivery. Saturation, content and delivery are three different quantities. Only content includes the haemoglobin, and only delivery includes the cardiac output, which this page does not model at all.
- Expecting anaemia to move the curve. It does not. Not left, not right, not at all. Anaemia changes the vertical scale of oxygen content, and the curve is drawn on a saturation axis, which is normalised.
- Reassurance from a normal saturation on the flat part. Ninety percent saturation is a partial pressure of 60 mmHg, which is a long way from healthy.
- Thinking more oxygen fixes low content. The dissolved term is 0.003 mL/dL per mmHg. Getting a useful amount of oxygen that way needs pressures that are not available outside a hyperbaric chamber.
- Confusing the Bohr and Haldane effects. Bohr is carbon dioxide and acid changing the affinity for oxygen. Haldane is oxygen changing the affinity for carbon dioxide. They are two halves of the same cooperation, and only the first one is on this page.
- Assuming a left-shifted curve is protective. It picks oxygen up well and holds onto it, which is useful in a placenta and useless in a working muscle.
Model and assumptions
- Method
- Exact expression, no time stepping
- Repeatability
- Deterministic. The same link gives the same numbers on any machine.
What it assumes
- An equilibrium curve evaluated as a function of conditions, with no state and no time.
- Cooperative binding is represented by a Hill-type relationship, with the Bohr shift entering through pH, carbon dioxide and temperature.
- Blood is treated as well mixed at a single set of conditions.
Numerical accuracy
No method error to report: the result is a closed-form expression evaluated directly, with no time stepping to accumulate error. What remains is double-precision rounding, of order one part in 10^16 per operation.
Common questions
Why is the curve sigmoid rather than a straight line?
Because of cooperative binding. Haemoglobin has four binding sites, and each oxygen that binds changes the protein’s shape so that the next one binds more readily. That makes the middle of the curve steep, since a small fall in partial pressure releases a lot of oxygen, and it flattens both ends. Myoglobin has one site, no cooperativity and a plain hyperbolic curve, which is the cleanest way to see that the shape comes from the interaction between sites rather than from the chemistry of oxygen.
Why does the flat top matter clinically?
Because it means saturation is a poor early warning. Between arterial partial pressures of about 100 and 60 mmHg the curve barely moves, so saturation stays above 90 percent while the partial pressure falls by nearly half. A patient can lose a great deal of respiratory reserve with almost no change in the number on a pulse oximeter. Below about 60 mmHg the curve steepens and saturation then drops quickly, which is why that point is treated as a threshold rather than as a gradual boundary.
What does a right shift do?
It lowers haemoglobin’s affinity for oxygen, so P50 rises and the curve moves right and down. That means less oxygen is picked up in the lung but more is released in the tissue, and at the partial pressures found in metabolically active tissue the release effect dominates. Acidosis, a higher carbon dioxide level, fever and raised 2,3-BPG all shift it right, and all four are signals of tissue working hard, which is what makes the shift useful rather than merely a curiosity.
Is the Bohr effect the pH or the carbon dioxide?
Both, and they are separable. Most of the effect is pH: protons bind to haemoglobin and stabilise the low-affinity form. On top of that, carbon dioxide has its own direct action, forming carbamino compounds with the terminal amino groups, which shifts the curve independently of the pH change it also causes. In the body the two travel together, which is why they are usually taught as one effect, and this simulator separates them so you can see how much each contributes.
Why does stored blood deliver oxygen poorly?
Because 2,3-BPG falls during storage. That molecule binds in the central cavity of deoxyhaemoglobin and holds it in the low-affinity state, so losing it shifts the curve left: the blood binds oxygen well in the lung and is reluctant to give it up in the tissue. Set 2,3-BPG to zero here and watch P50 fall. The same mechanism explains why fetal haemoglobin, which binds 2,3-BPG weakly, sits to the left of adult haemoglobin and can therefore take oxygen from the maternal circulation.