Photosynthesis Rate Simulator
The rate of photosynthesis is set by whichever of light, CO₂ or temperature is limiting. Change each, see the limiting factor and count oxygen bubbles.
Simulator
- Net rate Oxygen released per square metre of leaf each second, after the leaf’s own respiration. The model counts one oxygen for each carbon dioxide fixed, so this is also the net CO₂ taken up.
- 14.04 µmol m⁻² s⁻¹
- Bubbles From a sprig with 10 cm² of leaf, taking every bubble to hold 1 mm³ of gas at the water’s temperature. The scale is the model’s choice, not a measurement: real bubbles vary in size.
- 20.6 per minute
- Limiting factor The light reactions cannot regenerate RuBP any faster, so more light would raise the rate. In bright light at high CO₂ this is the leaf’s own capacity for electron transport rather than the supply of light, which is why the curve still flattens.
- Light
- CO₂ limits above The light at which the graph against light bends over. Below it, more light raises the rate; above it, only more carbon dioxide or a better temperature does. At high CO₂ light limits all the way up.
- 491 µmol m⁻² s⁻¹
- Compensation point The light at which photosynthesis just balances respiration, so the net rate is zero and no bubbles form.
- 16.1 µmol m⁻² s⁻¹
- Best temperature The temperature giving the highest net rate at this light and carbon dioxide. It is lower in dim light, where warmth cannot speed up a leaf that is short of light and only adds photorespiration and respiration, and higher at high CO₂, which holds photorespiration down.
- 27.1 °C
- Gross and respiration Photosynthesis before respiration is taken off, then respiration itself. Net is the first minus the second.
- 15.00 / 0.96 µmol m⁻² s⁻¹
- Light-limited rate
- CO₂-limited rate
- Net rate
Citing this tool
Last updated . Add the date you accessed it as well, which a citation of a page that can change asks for. If a specific result matters, cite the permalink from the tool’s share row instead of this page: it reproduces the exact parameters.
The equation
Farquhar, von Caemmerer and Berry (1980)
What sets the rate of photosynthesis
The rate of photosynthesis is set by whichever of light, carbon dioxide and temperature is
holding it back most. That one is the limiting factor: raising it raises the rate, while
raising the others does little. This simulator runs the standard biochemical model of
photosynthesis in a C3 leaf, by Farquhar, von Caemmerer and Berry (1980), in which the net rate is
A = min(A_c, A_j) - R_d: the smaller of the rate at which the enzyme Rubisco can
fix carbon dioxide, A_c, and the rate at which the light reactions can keep it
supplied, A_j, less the leaf’s own respiration, R_d.
In dim light the light reactions are the bottleneck, so the leaf is light limited and more
light means more photosynthesis. In bright light Rubisco becomes the bottleneck and carbon
dioxide is the limiting factor: more light changes nothing, and only more carbon dioxide or a
better temperature raises the rate. Temperature is not a supply of anything. It changes how
fast both steps run: in a cold leaf warming raises the rate, which is why syllabuses count
temperature as a limiting factor, and past an optimum warming lowers it again, so the graph
against temperature shows an optimum rather than a third dashed line. The idea
that a process runs at the pace of its slowest factor is Blackman’s law of limiting factors,
from 1905, and the min in the equation is that law at the scale of a chloroplast.
How to use it
Set the light, the carbon dioxide and the temperature. The readouts give the net rate, the bubbles a minute the pondweed would give off, the limiting factor, the light above which carbon dioxide takes over, the compensation point where photosynthesis just balances respiration, and the best temperature for the light and carbon dioxide you have set.
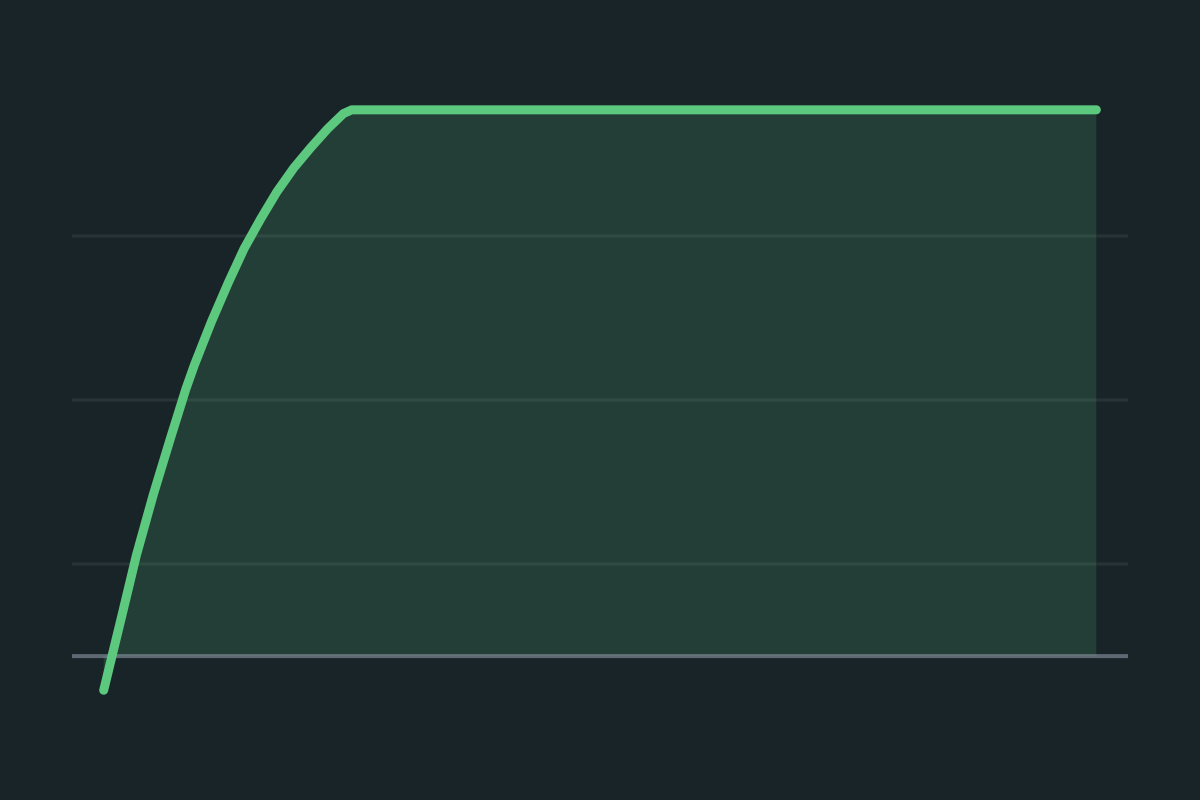
The graph plots the net rate against light, carbon dioxide or temperature, whichever you choose, with the other two held where you set them. The two dashed lines are the rate light alone would allow and the rate carbon dioxide alone would allow. The solid line always lies on the lower of the two, so the limiting factor is whichever dashed line it follows, and the corner is where the limit changes. That is the graph an exam question asks you to read, drawn with the reason for its shape included.
Worked example: a leaf at 25 °C in today’s air
Take the settings the simulator opens with: 400 µmol m⁻² s⁻¹ of light, 430 ppm of carbon dioxide and 25 °C, the temperature every constant is quoted at, so nothing needs correcting for temperature.
-
Carbon dioxide inside the leaf:
Ci = 0.7 × 430 = 301 ppm. -
The Rubisco limit. With oxygen competing, Rubisco’s apparent Michaelis constant is
Kc(1 + O/Ko) = 404.9 × (1 + 210/278.4) = 710.3 ppm, soA_c = 64 × (301 - 42.75)/(301 + 710.3) = 16.34 µmol m⁻² s⁻¹. -
The light limit. Photosystem II receives
0.36125 × 400 = 144.5, the smaller root of0.7J² - (144.5 + 134)J + 144.5 × 134 = 0isJ = 89.79, andA_j = 89.79 × (301 - 42.75)/(4 × 301 + 8 × 42.75) = 15.00 µmol m⁻² s⁻¹. -
The smaller is 15.00, so light is the limiting factor. Respiration is
0.015 × 64 = 0.96, which leaves a net rate of 14.04 µmol m⁻² s⁻¹. -
The bubbles. A sprig with 0.001 m² of leaf gives off
14.04 × 0.001 × 60 = 0.842 µmolof oxygen a minute. One micromole of gas at 25 °C and one atmosphere fills 24.47 mm³, so that is 20.6 mm³, or 20.6 bubbles a minute at 1 mm³ each.
The readouts show 14.04 and 20.6. Now raise the light. The light-limited rate climbs until it meets the Rubisco limit at 491 µmol m⁻² s⁻¹, and from there the net rate stays at 15.38 however bright the lamp: carbon dioxide has become the limiting factor. Converting micromoles of gas to a volume is the ideal gas law, which the ideal gas law calculator does for any temperature and pressure.
Reading the graph for the limiting factor
Textbooks show the limiting factor with two curves of rate against light, one at low carbon dioxide and one at high. Where the curves run together, light limits; where they separate, the lower one is being held back by carbon dioxide. Draw that here by setting the graph to light and moving the carbon dioxide slider. At 430 ppm the curve flattens at the Rubisco limit, and at full sunlight the rate rises from 15.38 to 25.40 µmol m⁻² s⁻¹ between 430 and 1000 ppm.
One thing the textbook drawing leaves out. In dim light the two curves are not quite on top of each other: at 1000 ppm the curve starts 25 percent steeper than at 430 ppm, and at 400 µmol m⁻² s⁻¹ the net rate is 27 percent higher, 17.82 rather than 14.04, even though light is the limiting factor at both. Extra carbon dioxide suppresses photorespiration, so each photon fixes more carbon. Ehleringer and Björkman measured exactly this dependence of the quantum yield of C3 plants on carbon dioxide in 1977. The limiting factor is the one that makes most difference, not the only one that makes any.
At high carbon dioxide the curve against light still flattens, and the limiting factor readout still says light. Above about 858 ppm at 25 °C Rubisco never becomes the bottleneck: the leaf is limited by its own capacity for electron transport, which at full sunlight is running at 94 percent of its maximum. In school terms the leaf itself has become the limit: its chlorophyll and the machinery around it, which syllabuses list alongside light, carbon dioxide and temperature.
Why there is an optimum temperature
Warming speeds up the enzymes, and it also speeds up the processes that undo their work. In bright light at 430 ppm the best temperature is 28.0 °C; at 1000 ppm it is 33.0 °C, and in dim light it is lower, 21.4 °C at 200 µmol m⁻² s⁻¹. The optimum is not a property of the leaf alone. It depends on what the leaf is short of.
The fall above the optimum is not mainly the enzyme giving out. Between 28 and 40 °C in bright light at 430 ppm, Rubisco’s capacity still rises by a third, from 82.5 to 109.1 µmol m⁻² s⁻¹, yet the net rate falls from 15.82 to 5.68. Three things outrun it. Rubisco’s apparent Michaelis constant for carbon dioxide nearly triples, from 920 to 2581 ppm, because it binds carbon dioxide less well relative to oxygen as it warms, so at the same carbon dioxide it runs much further below its capacity. Photorespiration’s share of the carbon fixed rises from 16.5 to 29.5 percent. And respiration doubles, from 1.16 to 2.35 µmol m⁻² s⁻¹. By 45 °C the net rate is 0.05, next to nothing. The enzyme capacities do deactivate as well, peaking near 36 °C for Rubisco and 35 °C for electron transport, which is the part school answers put down to denaturing. How strongly temperature changes the rate of a single reaction is the Arrhenius equation, which the collision theory simulator takes apart.
Rubisco’s rate has the same form as any enzyme with a competitive inhibitor:
V = Vmax[S]/(Km(1 + [I]/Ki) + [S]), with carbon dioxide as the substrate and oxygen
as the inhibitor. The enzyme kinetics simulator
shows what that does to a saturation curve, and its competitive mode gives exactly this rate.
The pondweed practical, and what bubbles can tell you
The school version of this measurement is AQA’s required practical on photosynthesis, number 6 in GCSE Biology and 5 in Combined Science: Trilogy. As BBC Bitesize sets it out, 8 cm of Cabomba goes into a boiling tube of 45 cm³ of 1 percent sodium hydrogencarbonate solution, 10 cm from a lamp. After five minutes to settle, the bubbles coming from the cut end of the stem are counted for one minute, the count is repeated five times and averaged, and the lamp is moved to a new distance. The sodium hydrogencarbonate is there to supply carbon dioxide, so that it is not the limiting factor.
Light intensity falls with the square of the distance, I ∝ 1/d², so moving the
lamp from 10 to 20 cm leaves a quarter of the light. That holds exactly only for a small source
some way off, and a lamp close to the tube also warms the water, which is why temperature is a
control variable. The simulator sets the light directly instead, in µmol m⁻² s⁻¹, the unit
light meters for plants report.
The counter shows why the method repeats the count. At the opening settings the rate is 20.6 bubbles a minute, which cannot fit into any single minute, so the first five minutes count 20, 21, 20, 21 and 21, and only their mean, 20.6, matches the rate. After n minutes the mean is within 1/n of it. Real counts also scatter because bubbles differ in size; the standard deviation calculator gives the mean and spread of a set of counts. Collecting the gas in a syringe and measuring its volume avoids the size problem altogether.
Limiting factors in a greenhouse
Commercial growers raise carbon dioxide only when it will pay. The Ontario agriculture ministry’s factsheet on carbon dioxide in greenhouses (Blom and others, 2002) recommends that vegetable growers supplement to 1000 ppm on sunny days with the vents closed, and to only 400 ppm on cloudy days when the light is below 40 W/m². The model shows why. At 25 °C, raising carbon dioxide from 430 to 1000 ppm raises the net rate by 65 percent at full sunlight, from 15.38 to 25.40, but by 28 percent at 200 µmol m⁻² s⁻¹, from 8.83 to 11.30, because in dim light carbon dioxide is not what the leaf is short of.
Where the numbers come from
The leaf is an average one: its Rubisco capacity of 64 and electron transport capacity of 134 µmol m⁻² s⁻¹ are the means over 109 C3 species in Wullschleger (1993), taken here as the values at 25 °C. Rubisco’s constants at 25 °C, 404.9 ppm for carbon dioxide, 278.4 mmol/mol for oxygen and a compensation point of 42.75 ppm, and their activation energies are Bernacchi and others (2001), measured in living leaves between 10 and 40 °C. The temperature response of the two capacities is Kattge and Knorr’s (2007) for a leaf grown at 25 °C, with the activation energies the Community Land Model 5 uses. The light response follows von Caemmerer (2021): a curvature of 0.7, a leaf absorbing 85 percent of the light, half of it going to photosystem II, and a correction of 15 percent for its spectrum. Respiration is 1.5 percent of the Rubisco capacity, as in Collatz and others (1991), and the carbon dioxide inside the leaf is 0.7 of the outside level, the typical ratio for C3 plants with enough water (Salesse-Smith, Wang and Long 2025).
The default of 430 ppm is today’s air to the nearest 10: NOAA’s preliminary global mean for June 2026 was 427.62 ppm. As a check against measurement, the model’s initial slope at 30 °C and the 330 ppm or so of the air when Ehleringer and Björkman worked is 0.055 mol of carbon dioxide per mole of absorbed light. They measured 0.052 across C3 species.
What this model leaves out
Stomata. The carbon dioxide inside the leaf is a fixed fraction of the outside level. A real leaf closes its stomata when short of water or in dry air, which can make carbon dioxide limiting at any light.
Water plants are not land leaves. The rate model is for a C3 land leaf, and the bubble count scales it to a sprig with 10 cm² of leaf and bubbles of 1 mm³. Those are choices that give a countable number, not measurements of Cabomba. Submerged leaves generally have a low photosynthetic capacity per square metre, and about half of the submerged flowering plants tested can take up hydrogencarbonate ions as well as dissolved carbon dioxide (Maberly and Madsen 2002). The pattern the counter shows is the model’s; the absolute count is not a prediction for a real tube.
Acclimation and damage. The leaf was grown at 25 °C and does not adjust to the temperature you set, as real leaves do over days. Below 10 °C and above 40 °C the enzyme constants are extrapolated, and nothing here models heat damage or damage from too much light.
The third limit. The full model has a third cap on the rate at high carbon dioxide, set by how fast the leaf can use the sugars it makes. It is left out: it matters mainly at high carbon dioxide, and it is not part of a school or first-year course.
The colour of the light. Every photon here counts the same. Chlorophyll absorbs red and blue light more strongly than green, which is what the coloured filter extension of the practical sets out to compare.
Common mistakes
- Calling the smallest number the limiting factor. It is the factor holding the rate back most, and it is found by asking which change would raise the rate, not by comparing numbers in different units.
- Expecting brighter light to help past the corner. Above 491 µmol m⁻² s⁻¹ at 430 ppm and 25 °C, only more carbon dioxide or a better temperature raises the rate.
- Saying the enzymes denature at the optimum. In this model the fall begins while Rubisco’s capacity is still rising. As it warms, Rubisco binds carbon dioxide less well relative to oxygen, so it works further below its capacity and loses more to photorespiration, and respiration rises as well. The capacities themselves fall only past their own peaks, at higher temperatures still.
- Forgetting respiration. The leaf respires in the light too. Below the compensation point, 16.1 µmol m⁻² s⁻¹ at the opening settings, the net rate is negative and there are no bubbles, however much the leaf is photosynthesising.
- Trusting a single minute’s count. Counts are whole numbers and bubbles vary in size. Repeat the count and use the mean.
- Treating 1/d² as exact for a lamp a few centimetres away. The law assumes a small, distant source, and a close lamp heats the water as well as lighting it.
Model and assumptions
- Method
- Exact expression, no time stepping
- Repeatability
- Deterministic. The same link gives the same numbers on any machine.
What it assumes
- Net photosynthesis is the Farquhar, von Caemmerer and Berry (1980) model of a C3 leaf: the lower of the Rubisco-limited and light-limited rates, less respiration.
- Electron transport follows a non-rectangular hyperbola in light with a curvature of 0.7, driven by 36 percent of the incident light, as von Caemmerer (2021) gives it.
- The carbon dioxide inside the leaf is held at 0.7 of the level outside, so the stomata never close and nothing resists diffusion inside the leaf.
- Rubisco kinetics follow Bernacchi et al. (2001), and the leaf has the average capacities of 109 species in Wullschleger (1993), grown at 25 °C and not acclimated to the temperature set.
- The bubble count assumes a sprig with 10 cm² of leaf, bubbles of 1 mm³, and all the net oxygen leaving as bubbles, one for each carbon dioxide fixed.
Where it stops holding. Below 10 °C and above 40 °C, where the enzyme constants are extrapolated past the range they were measured over; for leaves short of water, whose stomata close; and for water plants, many of which take up hydrogencarbonate and whose submerged leaves generally have a low capacity per square metre.
Numerical accuracy
No time stepping, so nothing accumulates. Every rate, the light at which carbon dioxide takes over as the limit, the compensation point and every bubble time are closed forms, exact to rounding. The best temperature is the one number found by search: a scan at 0.05 °C steps, then golden-section search, which pins it far more finely than the tenth of a degree it is shown to.
Common questions
What are the limiting factors of photosynthesis?
Light intensity, carbon dioxide concentration and temperature: whichever is holding the rate back most is the limiting factor, so raising it raises the rate, while raising the others does little. The amount of chlorophyll limits too, but a leaf cannot change it from minute to minute. In this model light limits in dim light and carbon dioxide takes over in bright light, above 491 µmol m⁻² s⁻¹ for a leaf at 25 °C in air of 430 ppm, while temperature changes how fast both run, which is why it has an optimum.
Why does the rate of photosynthesis level off as light intensity increases?
Because another factor becomes the limit. In dim light the light reactions cannot make ATP and NADPH fast enough, so more light means more photosynthesis. Once they can, the enzyme Rubisco cannot fix carbon dioxide any faster at the carbon dioxide level available, so extra light adds nothing and the graph flattens. Raise the carbon dioxide and the flat part moves up, which is the classic evidence that carbon dioxide was the limiting factor there.
What is the optimum temperature for photosynthesis?
About 28 °C for the average C3 leaf modelled here in bright light and air of 430 ppm, and it is not a fixed number. At 1000 ppm it rises to 33.0 °C, and in dim light it falls, to 21.4 °C at 200 µmol m⁻² s⁻¹. Above the optimum the rate drops because Rubisco binds carbon dioxide less well relative to oxygen, so photorespiration takes a larger share, and because respiration rises. The enzyme constants were measured between 10 and 40 °C, so figures outside that range are extrapolations.
How does moving the lamp change the light intensity?
Light intensity falls with the square of the distance, so doubling the distance from the lamp leaves a quarter of the light: intensity is proportional to 1/d². Moving a lamp from 10 cm to 20 cm would take the light from 400 to 100 µmol m⁻² s⁻¹. The rule holds exactly only for a small source some way off, and a lamp close to the tube also warms the water, which is why temperature has to be kept constant in the practical.
Why count bubbles, and how accurate is it?
Because the oxygen photosynthesis releases leaves the cut stem as bubbles, so the faster the rate, the more bubbles each minute. It is a rough measure: bubbles differ in size, some oxygen dissolves in the water instead, and one minute’s count is always a whole number. Counting for several minutes and averaging, or collecting the gas in a syringe and measuring its volume, does better. The counter here makes every bubble 1 mm³, so its counts differ from the rate only because each minute holds a whole number of bubbles.