Psychrometric Chart Explorer
An interactive psychrometric chart at sea level or altitude: drag a state to read humidity ratio, dew point, wet bulb and enthalpy, then draw a process.
Visualiser
Drag the point, or tap the chart to move it there. With the chart focused, the left and right arrow keys change the dry bulb by 0.5 °C, and up and down change the relative humidity by 1%, or by 10% with Page Up and Page Down.
A psychrometric chart at sea level, 101.3 kPa, with dry-bulb temperature from −10 to 50 °C along the bottom and humidity ratio up the right-hand side. The state, 25 °C and 50% relative humidity, sits at 9.88 g/kg. A horizontal line from it meets the saturation curve at the dew point, 13.9 °C, and the wet-bulb line through it meets the curve at 17.9 °C.
- Humidity ratio W = 0.621945 pw / (p − pw) = 0.009881 kg of water vapour per kilogram of dry air, what a horizontal line through the state reads on the right-hand axis.
- 9.881 g/kg dry air
- Dew point The temperature at which the saturation pressure equals this air’s vapour pressure, 1.585 kPa, found by bisection on Hyland and Wexler’s equation. Cool the air below it and water condenses.
- 13.86 °C
- Wet-bulb temperature The thermodynamic wet bulb t*, at which [(2501 − 2.326 t*) Ws* − 1.006 (t − t*)] / (2501 + 1.86 t − 4.186 t*) equals W, found by bisection between the dew point and the dry bulb.
- 17.89 °C
- Relative humidity φ = pw / pws = 1.585 / 3.169 kPa: the vapour pressure as a share of the saturation pressure at 25 °C.
- 50 %
- Specific enthalpy h = 1.006 t + W(2501 + 1.86 t): the heat in the dry air plus the latent and sensible heat in its vapour, counted from 0 °C.
- 50.32 kJ/kg dry air
- Specific volume v = 0.287042 (t + 273.15)(1 + 1.607858 W) / p, the volume that holds one kilogram of dry air with its vapour. Dividing a volume flow by it gives the mass flow of dry air.
- 0.858 m³/kg dry air
- Vapour pressure pw = p W / (0.621945 + W), the partial pressure of the water vapour. Saturated air at this dry bulb would have 3.169 kPa.
- 1.585 kPa
- Barometric pressure The standard atmosphere at 0 m: p = 101.325 (1 − 2.25577 × 10⁻⁵ Z)^5.2559 kPa.
- 101.3 kPa
Solid curves are relative humidity every 10%, the bold one saturation. Dashed lines are constant wet bulb, labelled in °C where they meet saturation. The dashed guides run from the state to its dew point, td, its wet bulb, t*, and the two axes.
- This air heated or cooled at constant moisture
- Saturation
Citing this tool
Last updated . Add the date you accessed it as well, which a citation of a page that can change asks for. If a specific result matters, cite the permalink from the tool’s share row instead of this page: it reproduces the exact parameters.
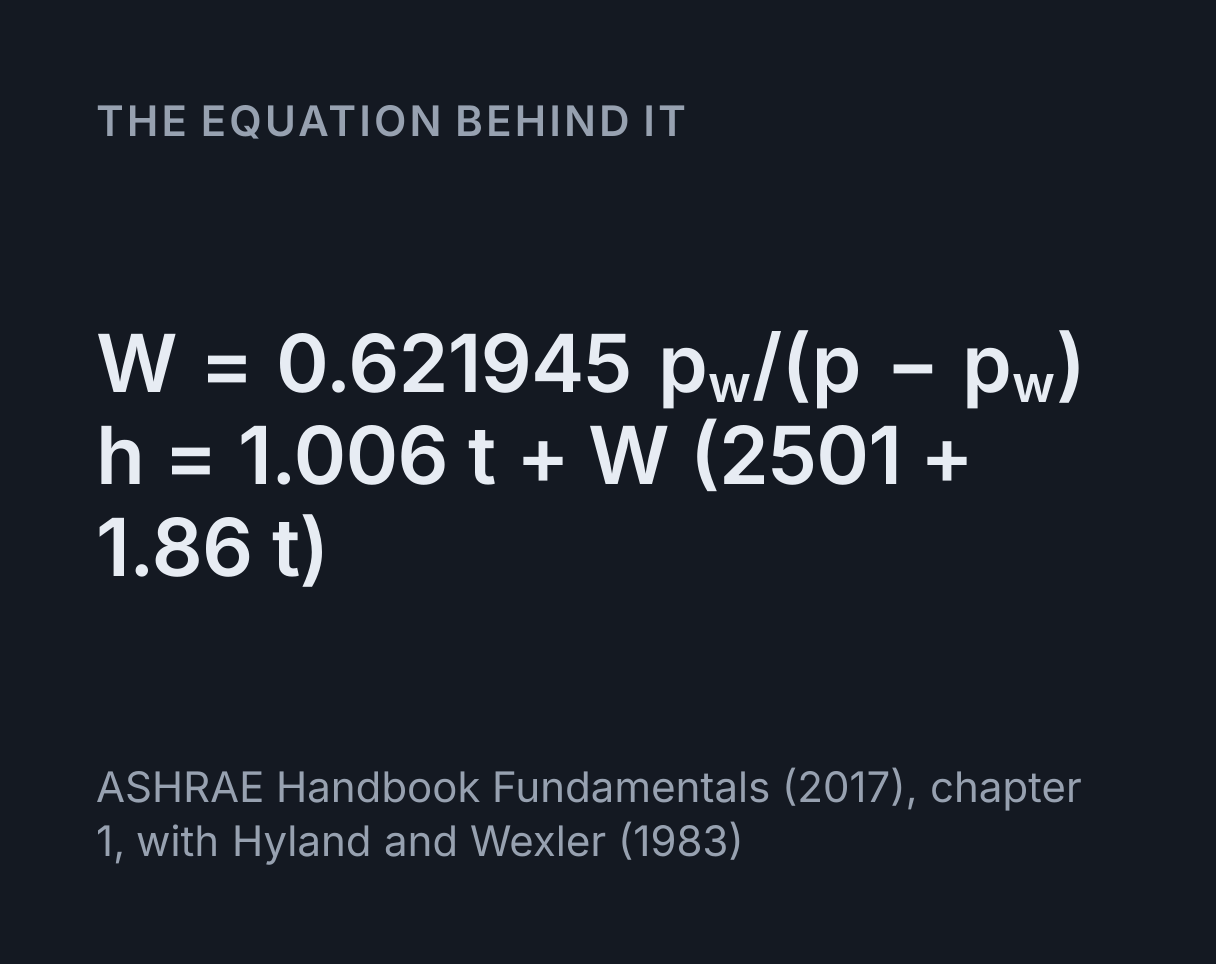
The equation
ASHRAE Handbook Fundamentals (2017), chapter 1, with Hyland and Wexler (1983)
What is a psychrometric chart?
A psychrometric chart is a graph of the properties of moist air at one barometric pressure. Dry-bulb
temperature runs along the bottom and humidity ratio, the mass of water vapour carried by each
kilogram of dry air, runs up the right-hand side, so every point on the chart is one state of the
air. The humidity ratio follows from the vapour pressure: W = 0.621945 pw / (p − pw),
where pw is the partial pressure of the water vapour, p is the total
pressure and 0.621945 is the ratio of the molar masses of water and dry air.
The curves that rise ever more steeply to the right are lines of constant relative humidity, the highest being the saturation curve, and the sloping straight lines are constant wet bulb, enthalpy and specific volume. Any two independent properties fix a state, and the chart turns those two into all the rest, which is why it is the working tool of air conditioning, drying and much of meteorology. European textbooks often draw the same information as a Mollier h-x diagram, with the two axes swapped.
Using the explorer
The chart opens on air at 25 °C and 50 percent relative humidity at sea level. Drag the point, or tap the chart to move it there; a drag above the saturation curve holds the point on it, since air cannot be more than saturated. With the chart focused, the left and right arrow keys change the dry bulb and up and down change the second property.
The first menu chooses that second property: relative humidity, the wet bulb a sling psychrometer reads, or the dew point a chilled-mirror hygrometer reads. The pressure comes from an altitude, through the standard atmosphere, or from a barometric reading. The process menu draws a second state from the first. A second, smaller plot follows this air as it is heated or cooled with its water held fixed: its relative humidity is 100 percent at the dew point and falls to under 13 percent at 50 °C.
Reading the chart and the readouts
- Dry-bulb temperature is what an ordinary thermometer reads, along the bottom.
- Humidity ratio, W, is read straight across on the right-hand axis, in grams of water per kilogram of dry air. Every horizontal line is air holding the same amount of water.
- Relative humidity is
φ = pw / pws, the vapour pressure as a share of the saturation pressure at the dry bulb. The curves are every 10 percent, and the bold one, 100 percent, is saturation. - Dew point is where a horizontal line from the state meets the saturation curve: cool the air with its water held fixed and it saturates there.
- Wet-bulb temperature is where the sloping wet-bulb line through the state meets the saturation curve. A thermometer with a wet wick in moving air reads close to it, because evaporation cools the wick until the heat flowing in from the air balances the latent heat the water carries away.
- Specific enthalpy,
h = 1.006 t + W(2501 + 1.86 t)in kJ per kilogram of dry air, is the heat content counted from dry air and liquid water at 0 °C. Its lines lie almost on the wet-bulb lines, but not exactly. - Specific volume,
v = 0.287042 (t + 273.15)(1 + 1.607858 W) / p, is the volume holding one kilogram of dry air with its vapour: the ideal gas law applied to the mixture, and what turns a duct’s volume flow into a mass flow.
The readouts give all of these to four significant figures, with the vapour pressure and the barometric pressure. Every value is per kilogram of dry air, because the dry air passes through a process unchanged while its water comes and goes.
Worked example: 25 °C and 50 percent relative humidity at sea level
These are the explorer’s opening settings, at the standard sea-level pressure of 101.325 kPa.
-
Saturation pressure at 25 °C, from Hyland and Wexler’s equation:
pws = 3.1692 kPa. - Vapour pressure at 50 percent:
pw = 0.5 × 3.1692 = 1.5846 kPa. -
Humidity ratio:
W = 0.621945 × 1.5846 / (101.325 − 1.5846) = 0.009881 kg/kg, the 9.881 g/kg the readout shows. -
Enthalpy:
h = 1.006 × 25 + 0.009881 × (2501 + 1.86 × 25) = 25.15 + 25.17 = 50.32 kJ/kg. -
Specific volume:
v = 0.287042 × 298.15 × (1 + 1.607858 × 0.009881) / 101.325 = 0.858 m³/kg. -
Dew point: the temperature whose saturation pressure is 1.5846 kPa,
td = 13.86 °C. -
Wet bulb: the wet-bulb equation gives
W = 0.008804att* = 17 °CandW = 0.01002att* = 18 °C, so the wet bulb lies between them, and halving the gap again and again settles ont* = 17.89 °C.
On the chart, the horizontal guide through the point at 9.881 g/kg meets the saturation curve at 13.86 °C, and the dashed wet-bulb guide meets it at 17.89 °C. Half of the enthalpy, 25.15 kJ/kg, belongs to the dry air. The other 25.17 kJ/kg is carried by less than a hundredth of a kilogram of vapour, almost all of it latent heat. The 2501 in the enthalpy equation is the latent heat of vaporisation at 0 °C in kJ/kg, a little more than the 2260 J/g at the boiling point that the latent heat calculator works with.
How the wet bulb and the dew point are found
Two readings are not a single formula of the state. The dew point is the temperature at which the
saturation pressure equals the vapour pressure, and Hyland and Wexler’s equation gives the pressure
from the temperature, not the other way round. The wet bulb is the temperature t* that
satisfies ASHRAE’s wet-bulb equation,
W = [(2501 − 2.326 t*) Ws* − 1.006 (t − t*)] / (2501 + 1.86 t − 4.186 t*), in which
Ws* is itself the saturation humidity ratio at t*.
Both are solved by bisection. The wet-bulb search starts with the dew point and the dry bulb as its
bounds, which always bracket the answer: at t* = t the equation returns the saturation
value, at least as wet as the air, and at the dew point it returns less. Each step keeps the half of
the bracket that still holds the answer. For the opening state it takes 37 halvings to pin the wet
bulb to within 10⁻¹⁰ °C, and 42 for the dew point, whose search starts from the whole range the
equations hold for, −100 to 200 °C.
Many dew point calculators use the Magnus approximation instead,
td = 243.04 γ / (17.625 − γ) with γ = ln φ + 17.625 t / (243.04 + t). At
25 °C and 50 percent it also gives 13.86 °C, and wherever the dew point is above freezing it stays
within 0.06 °C of the exact inversion. Below 0 °C the explorer gives the frost point, over ice, as
ASHRAE’s equations do, which Magnus’s coefficients for water do not.
Drawing a process
Choose a process and a second point appears, joined to the first by an arrow. Each process starts from the state set above, works per kilogram of dry air, and opens on settings that suit the opening state.
- Sensible heating or cooling moves the point straight across, because no water is
added or removed. Heating to 35 °C takes
q = (1.006 + 1.86 × 0.009881) × (35 − 25) = 10.24 kJ/kg, and the relative humidity falls to 28.2 percent without a gram of water taken out. Cooling stops at the dew point. - Cooling and dehumidifying is what an air-conditioning coil does: it cools the air
below its dew point, so water condenses on the fins and drains away. Taking the opening air to
13 °C at 90 percent leaves 8.386 g/kg, so 1.495 g/kg condenses, and the coil removes
(50.32 − 34.25) − 0.001495 × 4.186 × 13 = 15.99 kJ/kg, the last term being the heat the cold condensate carries away. Carried on past the leaving state, the coil line meets the saturation curve at 10.94 °C, the apparatus dew point, which is the effective temperature of the wet coil surface. A leaving state whose line would miss the curve is one no coil can produce, and the explorer raises its humidity to the driest a coil can deliver. In a building, a controller holds the leaving temperature at its set point by working a chilled-water valve, the kind of loop the PID controller simulator lets you tune. - Evaporative cooling runs along the line of constant wet bulb, because the heat
that evaporates the water comes from the air itself. At a saturation effectiveness of 80 percent
the air leaves at
25 − 0.8 × (25 − 17.89) = 19.31 °Cand 87.3 percent, having picked up 2.367 g/kg of water, while its enthalpy rises by only 0.18 kJ/kg, the heat in the water fed in at the wet bulb. - Mixing two streams puts the mixture on the straight line between them, at the
share of the dry air each contributes, because dry air, water and enthalpy are all conserved.
Three parts of the opening air with one part of air at 5 °C and 80 percent give
W = 0.75 × 9.881 + 0.25 × 4.314 = 8.489 g/kgandh = 0.75 × 50.322 + 0.25 × 15.860 = 41.71 kJ/kg, which is 20.04 °C at 58.2 percent.
Two streams near saturation can mix to a point past the saturation curve, and then the excess condenses as fog. Saturated air at −5 °C and at 30 °C mixed in equal parts lands on the straight line at 12.89 °C and 14.84 g/kg. Once 2.066 g/kg has condensed, the latent heat it releases leaves the mixture saturated at 17.81 °C. Your breath on a cold morning is the same process, and the heat released is the energy of the long plateau on water’s heating curve, run the other way.
Altitude and barometric pressure
A printed chart is drawn for one pressure, usually sea level, and the explorer redraws it for any.
At a lower pressure the same vapour pressure means more water per kilogram of dry air, because each
cubic metre holds less dry air to share it with. At 1,500 m the standard atmosphere gives
p = 101.325 (1 − 2.25577 × 10⁻⁵ × 1500)^5.2559 = 84.56 kPa, and air at 25 °C and 50
percent holds 11.88 g/kg rather than 9.881, about 20 percent more.
The dew point does not change, because it depends only on the vapour pressure, which is 1.5846 kPa either way. The wet bulb falls by 0.43 °C, to 17.46 °C, since water evaporates more readily into thinner air. The specific volume rises to 1.031 m³/kg, so a fan moving a fixed volume of air moves about 17 percent less of it by mass.
Where the equations come from
Every number here comes from ASHRAE Handbook Fundamentals (2017), chapter 1, which treats moist air as a mixture of two perfect gases. The saturation pressure is Hyland and Wexler’s 1983 formulation, one equation over ice and one over liquid water, which meet at the triple point: at 0.01 °C the ice equation gives 611.657 Pa, the accepted triple-point pressure. At 25 °C the equation for water gives 3.1692 kPa against 3.1697 kPa in ASHRAE’s table of the properties of water at saturation, and at 50 °C it gives 12.350 kPa against 12.351 kPa. The standard atmosphere, humidity ratio, specific volume, enthalpy and wet bulb are the handbook’s equations 3, 20, 26, 30 and 33, the last in its ice form, equation 35, when the wick would be frozen. PsychroLib (Meyer and Thevenard, 2019), an open-source library, implements the same equations independently, and the explorer is tested against its published values as well as ASHRAE’s tables.
What this model leaves out
- Real-gas effects. Dry air and water vapour are treated as perfect gases. ASHRAE’s real-gas table puts the saturation humidity ratio at 25 °C at 20.17 g/kg, against the 20.08 g/kg of the perfect-gas equations here, about half a percent more.
- The thermometer’s own error. The wet bulb here is the thermodynamic one, the temperature of adiabatic saturation. A wet-bulb thermometer reads close to it in moving air, but high in still air or with sunshine on the wick.
- How a coil gets there. The coil process takes the leaving state as given and draws a straight line to it. A real coil’s path curves, and its leaving state depends on its surface, its rows of fins and the air speed.
- Fans and pressure drops. Every process runs at one pressure, although a real fan adds a little heat and the pressure falls a little through a coil or a filter.
- Ice and supercooled water. Below the triple point, saturation, relative humidity and the dew point are taken over ice, as ASHRAE’s equations take them. Weather services quote relative humidity over water even below freezing, and supercooled droplets can last well below 0 °C. An evaporative cooler with a wet bulb below 0 °C is left doing nothing.
Common mistakes
- Reading relative humidity as the amount of water. Heating air lowers its relative humidity without removing anything. The opening air heated to 35 °C still holds 9.881 g/kg, at 28.2 percent instead of 50.
- Mixing up the dew point and the wet bulb. The dew point is where the air saturates if it is cooled with its water held fixed; the wet bulb is where it saturates if water evaporates into it. The wet bulb lies between the dew point and the dry bulb, 17.89 °C between 13.86 and 25 °C here, and the three meet only at saturation.
- Using a sea-level chart at altitude. At 1,500 m, 25 °C and 50 percent is 11.88 g/kg, not the 9.881 g/kg a sea-level chart gives, and the specific volume is 1.031 m³/kg, not 0.858.
- Mixing by volume instead of by dry-air mass. 2 m³/s of outdoor air at 4 °C dry bulb and 2 °C wet bulb mixed with 6.25 m³/s of the opening air is 25.8 percent outdoor air by dry-air mass but 24.2 percent by volume, and the volume share puts the mixture at 19.95 °C instead of 19.63 °C. Divide each flow by its specific volume first.
- Reading the wet bulb off an enthalpy line. The two families nearly coincide, but the line of constant enthalpy through the opening state meets saturation at 17.82 °C, not at the wet bulb of 17.89 °C.
Common questions
How do you read a psychrometric chart?
Find the state where the vertical line for its dry-bulb temperature meets its relative humidity curve. Read the humidity ratio straight across on the right-hand axis, the dew point where a horizontal line from the point meets the saturation curve, and the wet-bulb temperature where the sloping wet-bulb line through the point meets that curve; enthalpy and specific volume have sloping lines of their own. At sea level, air at 25 °C and 50% relative humidity reads 9.88 g/kg, a dew point of 13.9 °C, a wet bulb of 17.9 °C, 50.3 kJ/kg and 0.858 m³/kg.
How do you calculate dew point from temperature and relative humidity?
Work out the vapour pressure, pw = φ × pws(t), then find the temperature whose saturation pressure is pw. At 25 °C the saturation pressure is 3.169 kPa, so at 50% relative humidity pw = 1.585 kPa, and the saturation pressure equals 1.585 kPa at 13.86 °C, the dew point. The Magnus approximation, td = 243.04 γ / (17.625 − γ) with γ = ln φ + 17.625 t / (243.04 + t), gives 13.86 °C too. The dew point does not depend on the barometric pressure, only on how much vapour the air holds.
How do you find relative humidity from wet-bulb and dry-bulb temperatures?
Put both into ASHRAE’s wet-bulb equation, W = [(2501 − 2.326 t*) Ws* − 1.006 (t − t*)] / (2501 + 1.86 t − 4.186 t*), where t* is the wet bulb and Ws* the saturation humidity ratio at it, then turn W into a vapour pressure and divide by the saturation pressure at the dry bulb. At sea level, a dry bulb of 30 °C and a wet bulb of 20 °C give Ws* = 0.01470 and W = 0.01052, so pw = 1.685 kPa against a saturation pressure of 4.246 kPa: 39.7% relative humidity. The explorer does this when the state is fixed by dry bulb and wet bulb.
What is the difference between wet-bulb temperature and dew point?
The dew point is the temperature at which air saturates if it is cooled with its water held fixed, so it measures only how much water the air holds. The wet bulb is the temperature at which it saturates if water evaporates into it with no heat from outside, so it also depends on how far the air is from saturation. The wet bulb always lies between the dew point and the dry bulb, and the three are equal only in saturated air. For air at 25 °C and 50% relative humidity at sea level, the dew point is 13.86 °C and the wet bulb 17.89 °C.
Does altitude change the psychrometric chart?
Yes. A chart is drawn for one barometric pressure, and at a lower pressure the same vapour pressure means more water per kilogram of dry air, since W = 0.621945 pw / (p − pw). At 1,500 m the standard atmosphere gives 84.56 kPa, and air at 25 °C and 50% relative humidity holds 11.88 g/kg instead of the 9.881 g/kg at sea level, with a wet bulb of 17.46 °C instead of 17.89 °C and a specific volume of 1.031 m³/kg instead of 0.858. The dew point, 13.86 °C, is the same, since it depends only on the vapour pressure.
What is the enthalpy of moist air?
It is the heat content of the air and its water vapour per kilogram of dry air, counted from dry air and liquid water at 0 °C: h = 1.006 t + W(2501 + 1.86 t) kJ/kg, where 1.006 is the specific heat of dry air, 2501 the latent heat of vaporisation of water at 0 °C and 1.86 the specific heat of water vapour. At 25 °C and a humidity ratio of 0.009881 kg/kg it is 25.15 + 25.17 = 50.32 kJ/kg, so about half of it is carried, as latent heat, by less than 1% of the mass. The change in enthalpy between two states is the heat a heater or coil must supply or remove, apart from any condensate.