Sampling and Aliasing Visualiser
Sample a sine wave at any rate and see aliasing: the slower sine through the samples, the Nyquist and alias frequencies, and the wagon wheel effect.
Visualiser
Change the signal frequency with the up and down arrow keys, and the sampling rate with left and right. Space plays and pauses.
A 9 Hz sine sampled 10 times a second, shown over 1 s. Its 11 samples lie on a 1 Hz sine, drawn dashed, which is what a reconstruction recovers. The wheel turns 0.9 of a turn between samples, which the camera sees as 0.1 of a turn backwards. In the spectrum after sampling, the tone at 9 Hz has an image at 1 Hz, inside the shaded band below the 5 Hz Nyquist frequency.
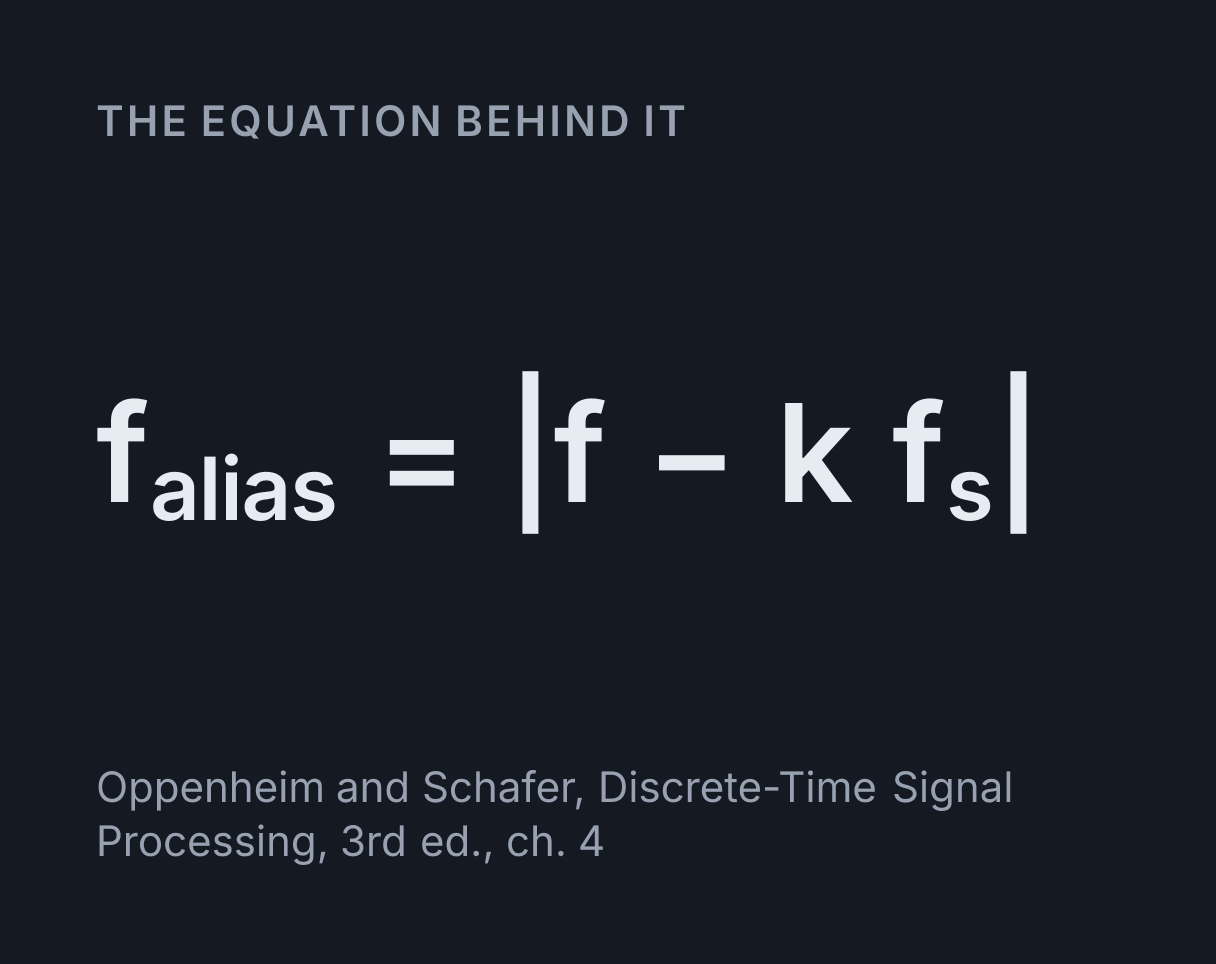
- Alias frequency The frequency the samples describe: |f − k fs| = |9 − 1 × 10| = 1 Hz, with k = 1 the whole number nearest f/fs. An alias always lies between 0 and fs/2.
- 1 Hz
- Nyquist frequency Half the sampling rate, fs/2 = 10/2 = 5 Hz. A tone below it is recorded faithfully, and one above it folds back below it.
- 5 Hz
- Aliased Above the 5 Hz Nyquist frequency a tone folds back below it: 9 Hz is recorded as 1 Hz.
- Yes
- Apparent rotation The alias with its sign kept, f − k fs = 9 − 10 = −1 Hz. A wheel turning 0.9 of a turn between frames is seen to turn 0.1 of a turn backwards, and the recovered sine runs in reverse.
- −1 Hz, backwards
- Nyquist rate Twice the highest frequency present, 2 × 9 = 18 Hz. The sampling rate has to be above it, not equal to it, to record every tone faithfully.
- 18 Hz
- Samples per cycle fs/f = 10/9. More than 2 samples a cycle records a tone faithfully, exactly 2 is the limit, and fewer aliases it.
- 1.111
Start from
- Alias frequency
- Nyquist frequency, 5 Hz
Citing this tool
Last updated . Add the date you accessed it as well, which a citation of a page that can change asks for. If a specific result matters, cite the permalink from the tool’s share row instead of this page: it reproduces the exact parameters.
The equation
Oppenheim and Schafer, Discrete-Time Signal Processing, 3rd ed., ch. 4
What is aliasing?
Aliasing is what happens when a signal is sampled too slowly to be recorded faithfully: the
samples fit a lower frequency exactly as well as the true one, so anything rebuilt from them
comes out at that lower frequency, the alias. A sine of frequency f sampled at a
rate fs is recorded at f_alias = |f − k fs|, where k is
the whole number nearest to f/fs.
Every alias lies between
0 and fs/2, the Nyquist frequency, and a tone is recorded as itself only if it is
already below fs/2. Above it the tone is not lost or blurred. It is replaced,
cleanly and with no warning, by a different tone.
The reason is that a sine repeats. Sampling takes a value at each instant
tₙ = n/fs, and between one sample and the next a tone at
f and a tone at f − k fs differ by exactly k whole cycles,
which no sample can see: sin(2π f n/fs) = sin(2π (f − k fs) n/fs) for every whole
number k. So a 1 Hz sine and an 11 Hz sine sampled 10 times a second give identical
numbers, and a 9 Hz sine gives the same numbers upside down, which is a 1 Hz sine running
backwards. Once the numbers are all that is left, nothing can say which tone made them.
Claude Shannon set this out as the sampling theorem in 1949, in “Communication in the Presence of Noise”, building on Harry Nyquist’s 1928 work on telegraph signalling, and E. T. Whittaker in 1915 and Vladimir Kotelnikov in 1933 reached the same result independently. The folding of the spectrum behind the alias formula is worked through in chapter 4 of Oppenheim and Schafer’s Discrete-Time Signal Processing.
Reading the visualiser
The main trace shows the true signal as a solid line, the samples as amber stems and dots, and
the recovered signal dashed: the one sine below fs/2 that passes through every
sample, which is what an ideal reconstruction returns. Below the Nyquist frequency the dashed
line lies on the signal. Above it, the dashed line goes its own slower way and still meets
every dot.
Play sweeps a playhead across the window, taking each sample as it passes, at half a second of real time per sample interval at 1x. The slow pace is deliberate: a screen redraws at its own frame rate, which is a second sampling, and could alias a fast picture itself. The window always spans between 8 and 20 sample intervals, in round lengths such as 0.5 s, 1 s and 2 s.
Below the trace on the left is the same tone as a wheel: the spoke turns once per cycle and its height is the signal. Each amber dot on the rim is where a sample caught the spoke, the dashed spoke turns at the speed the samples suggest, as a camera filming the wheel would show, and the arrow inside the rim is the step between the last two frames as the eye reads it.
On the right is the spectrum after sampling, with the band from 0 to fs/2 that a
reconstruction keeps shaded, and under the stage the folding diagram plots alias frequency
against signal frequency. Both are explained below. Of the readouts:
- Apparent rotation is the alias with its sign kept,
f − k fs: negative means the wheel seems to turn backwards. - Nyquist rate is twice the highest frequency present, which the sampling rate
has to exceed, and Samples per cycle is
fs/f.
The Start from buttons load the cases this page works through. The units menu switches the whole tool between hertz and seconds, kilohertz and milliseconds, or megahertz and microseconds. With the scene focused, the up and down arrow keys change the signal frequency by 0.5 and the left and right keys change the sampling rate.
Worked example: a 9 Hz sine sampled at 10 Hz
The visualiser opens on a 9 Hz sine sampled 10 times a second. By hand:
-
The Nyquist frequency is
fs/2 = 10/2 = 5 Hz, and 9 Hz is above it, so the tone aliases. - The nearest whole multiple of the rate:
f/fs = 9/10 = 0.9, sok = 1. -
The signed alias is
f − k fs = 9 − 10 = −1 Hz, sof_alias = 1 Hz, and the minus sign says it runs backwards. -
Check it on a sample. The first after
t = 0is att = 0.1 s, wheresin(2π × 9 × 0.1) = sin(324°) = −0.5878, and the backwards 1 Hz sine gives−sin(2π × 1 × 0.1) = −sin(36°) = −0.5878. The next issin(648°) = −sin(72°) = −0.9511from both. -
On the wheel, the spoke turns
9/10 = 0.9of a turn between frames, which the eye reads as0.9 − 1 = −0.1of a turn, 36° backwards a frame: one turn a second the wrong way, the −1 Hz of the readout. -
To record 9 Hz faithfully the rate has to be more than
2 × 9 = 18 Hz. At 10 Hz there are only10/9 = 1.111samples per cycle, against the more than 2 needed.
The readouts agree: an alias frequency of 1 Hz, a Nyquist frequency of 5 Hz, an apparent rotation of −1 Hz, backwards, a Nyquist rate of 18 Hz and 1.111 samples per cycle. Eleven samples fit the 1 s window, and the dashed sine through them completes exactly one cycle, falling first where a sine that starts at zero would rise.
The Nyquist frequency and the sampling theorem
The sampling theorem says that a signal with no frequency above B is fixed
completely by samples taken more than 2B times a second, and can be rebuilt exactly
from them. Two names come out of it that are easy to mix up. The Nyquist frequency,
fs/2, belongs to the sampler: it is the highest frequency a given rate can record.
The Nyquist rate, 2B, belongs to the signal: it is the rate a sampler has to beat
to record it. A CD samples at 44.1 kHz, so its Nyquist frequency is 22.05 kHz, and music that stops at
20 kHz has a Nyquist rate of 40 kHz.
The inequality is strict, and the Exactly at Nyquist preset shows why. A 5 Hz sine sampled at
10 Hz is caught twice a cycle, and every sample is sin(πn + φ) = (−1)ⁿ sin φ. With a
phase of 0 the samples all land on zero crossings and the tone vanishes completely. At 90° they
land on the peaks, alternating +1 and −1, and the tone survives. At 30° they are ±0.5, so the
reconstruction returns a tone of half the amplitude. Exactly twice a cycle, the samples cannot
tell amplitude from phase.
Just below the limit the samples suffice in principle but look strange: at 4.9 Hz and 10 Hz
they alternate in sign under an envelope that swells and fades every 5 seconds, a slow beat at
fs − 2f = 0.2 Hz, the gap between 4.9 Hz and its image at 5.1 Hz, and only a long run of them rebuilds the tone.
Why aliases fold back
The folding diagram under the stage shows the pattern for every frequency at once. The alias
rises with the signal frequency up to fs/2, falls back to 0 at fs,
rises again to fs/2 at 1.5 fs, and so on, like a strip of paper folded
at every multiple of fs/2. That is where the Nyquist frequency’s other name, the
folding frequency, comes from. Frequencies at the same height on the zigzag are
indistinguishable once sampled: at 10 Hz, tones of 4, 6, 14 and 16 Hz all come out at 4 Hz.
The spectrum strip shows the same thing from the other side. Sampling a tone at f
puts copies of it at every k fs ± f, and for 9 Hz at 10 Hz the strip up to 20 Hz
holds lines at 1, 9, 11 and 19 Hz. A reconstruction filter passes only the band from 0 to
fs/2, and exactly one copy always lands in it, which is the alias.
The CD audio preset makes it concrete. A 30 kHz tone is far above hearing, but sampled at
44.1 kHz it lands at |30 − 1 × 44.1| = 14.1 kHz, well inside the audible band, as a
whistle that was never in the room. CD audio covers sound up to 20 kHz, which leaves the
2.05 kHz between 20 kHz and the 22.05 kHz Nyquist frequency for a filter to remove everything
higher before the sampler sees it.
The wagon wheel effect
Film is sampling in time. A camera takes 24 frames a second, and a wheel turning 22 times a
second moves 22/24 = 0.917 of a turn between frames. The eye joins each frame to
the next by the shortest move that fits, 0.917 − 1 = −0.083 of a turn, which is 30°
backwards a frame. So on screen the wheel turns backwards twice a second,
22 − 24 = −2 turns a second, while the carriage rolls forwards. At exactly 24 turns a
second it stands still, and at 25 it creeps forwards once a second.
The Wagon wheel on film preset loads the 22-turn case. Watch the solid spoke race almost all the way round between frames while the amber dots, and the dashed spoke the camera sees, step back 30° at a time. A real wheel has identical spokes, so its picture repeats several times a turn and the frequency that folds is the spoke rate: a wheel with 12 spokes turning twice a second passes 24 spokes a second and stands still on film.
Controlled, the effect is useful. A stroboscope flashing at the frequency of a vibration freezes it, which is how a timing light reads an engine’s ignition timing. A school ripple tank, like the one in the Wave Interference Simulator, is watched under a stroboscope for the same reason: flashing at the dipper’s frequency catches each wave one cycle on, so the pattern looks frozen, and flashing slightly slower makes it creep forwards.
Two tones that land in the same place
Aliasing can also stack one tone on top of another. Load Two tones that cancel: 3 Hz and 7 Hz of equal strength, both starting at zero, sampled at 10 Hz. The 3 Hz tone
is below the 5 Hz Nyquist frequency and stays put, while the 7 Hz tone folds to
7 − 10 = −3 Hz, the same frequency upside down. Every sample is
sin(0.6πn) + sin(1.4πn) = 0, so the samples record silence, while between them the
signal swings as far as ±2.
That is why aliasing cannot be undone afterwards: once two frequencies share the same samples, no processing can separate them. Everything that prevents aliasing has to happen before the sampler.
Stopping aliasing before it starts
The cure is an anti-aliasing filter: a low-pass filter in front of the sampler that removes
everything at and above fs/2, so nothing is left to fold. No real filter cuts off
like a wall, so systems sample faster than twice the highest frequency they care about and give
the filter room to fall. The Bode Plot and Filter
Visualiser shows how gradually a low-pass filter’s gain falls above its corner frequency. A
first-order filter loses only 20 dB per decade, so audio converters use filters of much higher
order, or oversample and filter digitally before bringing the rate down.
Any instrument that samples can be caught out. A digital oscilloscope lowers its sample rate at slow timebase settings so that the record fits its memory, and a 1 MHz sine sampled 1.1 million times a second is drawn as a clean, steady 100 kHz sine. Changing the timebase is the usual check, because a real signal keeps its frequency when the sample rate changes and an alias does not. For how a scope turns a signal into a trace, see the Oscilloscope Simulator.
What this model leaves out
- Samples that take no time. Each sample here is an instant. A real converter averages over a short aperture or holds each value until the next, which slightly weakens the highest frequencies.
- Exact values and perfect timing. There is no quantisation, where a real converter rounds each sample to one of a fixed number of levels, 65,536 for 16-bit CD audio, and no clock jitter. Both add a little noise.
- Pure tones that last for ever. Real signals have harmonics, and each one folds on its own: a 3 kHz square wave has odd harmonics, and its 15th, at 45 kHz, lands at 0.9 kHz on a 44.1 kHz sampler, below the fundamental itself. The Fourier Series Visualiser builds a square wave from those harmonics one at a time.
- An ideal reconstruction. The recovered sine is what a perfect low-pass filter
would return from an endless run of samples. Real filters and short records fall short of it,
most of all close to
fs/2.
Common mistakes
- Mixing up the Nyquist frequency and the Nyquist rate. One is half the sampling rate and belongs to the sampler. The other is twice the highest frequency in a signal and belongs to the signal.
- Thinking aliasing starts above the sampling rate. It starts above half of it: a 6 Hz tone sampled at 10 Hz comes out at 4 Hz.
- Sampling at exactly twice the frequency. That is the limit, not a safe rate. A 5 Hz tone sampled at 10 Hz can come out as nothing at all.
- Filtering after sampling. By then an alias looks exactly like a real tone. The filter has to come before the sampler, and the highest frequency present sets the rate, harmonics and noise included.
- Believing a slow wobble in logged data. A logger reading a 50 Hz mains hum 49 times a second records a steady 1 Hz oscillation that is not there.
Common questions
What is the Nyquist frequency?
It is half the sampling rate, fs/2, and the highest frequency a sampler can record faithfully. A CD samples at 44.1 kHz, so its Nyquist frequency is 22.05 kHz, and any tone above that is recorded as a lower one, folded back below 22.05 kHz. It is also called the folding frequency. It is not the same as the Nyquist rate, which is twice the highest frequency in a signal, the rate a sampler has to exceed to capture it.
How do you calculate the alias frequency?
Find the whole multiple of the sampling rate nearest the signal frequency and take the difference: f_alias = |f − k fs|, where k is the whole number nearest f/fs. A 9 Hz tone sampled at 10 Hz has k = 1 and aliases to |9 − 10| = 1 Hz. A 30 kHz tone sampled at 44.1 kHz lands at 14.1 kHz, and a 1 MHz signal sampled at 1.1 MHz lands at 100 kHz. The answer always lies between 0 and half the sampling rate. When f − k fs is negative the alias runs backwards, which is how a wheel on film seems to turn the wrong way.
What does the sampling theorem say?
That a signal with no frequency above B is completely determined by samples taken more than 2B times a second, and can be rebuilt exactly from them by an ideal low-pass filter. Claude Shannon stated it in 1949, building on Harry Nyquist’s work of 1928, and E. T. Whittaker in 1915 and Vladimir Kotelnikov in 1933 reached it independently. The inequality is strict: a 5 Hz sine sampled exactly 10 times a second can have every sample land on a zero crossing and vanish.
Why do wheels look like they spin backwards on film?
Because film samples the wheel 24 times a second, and the eye joins each frame to the next by the shortest move. A wheel turning 22 times a second moves 0.917 of a turn between frames, which looks the same as 0.083 of a turn backwards, so on screen it turns backwards twice a second. At exactly 24 turns a second it seems to stand still. With identical spokes it is the spoke rate that counts: a wheel with 12 spokes turning twice a second passes 24 spokes a second and looks frozen.
What sampling rate do you need to avoid aliasing?
More than twice the highest frequency present, harmonics and noise included, with everything above half the sampling rate filtered out before sampling. No filter cuts off sharply, so real systems leave a margin: CD audio records sound up to 20 kHz but samples at 44.1 kHz, which leaves the 2.05 kHz up to its 22.05 kHz Nyquist frequency for the anti-aliasing filter to work in.
Can aliasing be removed after sampling?
No. Once a tone has folded onto another frequency, its samples are identical to those of a real tone at the alias, so no processing can tell them apart. Tones of 3 Hz and 7 Hz of equal strength, both starting at zero and sampled 10 times a second, give a sample of exactly zero every time, because the 7 Hz tone lands on 3 Hz upside down. The only cures are a low-pass filter before the sampler or a faster sampling rate.