Wave Interference Simulator
Simulate wave interference from two coherent sources on a ripple tank: waves reinforce where the path difference is mλ and cancel where it is (m + ½)λ.
Simulator
Drag or tap on the tank to move the probe, or move it with the arrow keys. Space plays and pauses.
- Path difference |r₁ − r₂| = 2.4 cm, divided by the wavelength of 1.6 cm. With the sources in step, a whole number means the waves arrive together and a whole number and a half means they cancel.
- 1.5 λ
- r₁ and r₂ How far the probe is from S₁ and from S₂, along the straight line each wave travels.
- 6.3 and 8.7 cm
- Phase difference The waves arrive 540° apart, 180° once whole cycles are taken out: 0° is crest on crest and 180° is crest on trough. That includes the 0° the sources start apart.
- 180 °
- Resultant amplitude How far the surface at the probe swings, as a share of a₁ + a₂, the two waves’ amplitudes added, which is what they give arriving in step. 0% is complete cancellation. Here a₂/a₁ is 0.851.
- 8.05 % of a₁ + a₂
- Nearest line The line whose path difference is closest to the probe’s, so the one the probe is on or nearest to, whichever lines the scene is drawing. m is the whole number in |r₁ − r₂| = mλ or (m + ½)λ.
- Nodal, m = 1
- Lines Both sides counted. For sources in step there are twice the whole number part of d/λ + ½ nodal lines and one more than twice the whole number part of d/λ antinodal ones; here d/λ is 3.75.
- 8 nodal, 7 antinodal
- Sum, the surface at the probe
- Wave from S₁
- Wave from S₂
- Coherent sources
- Same sources, incoherent
Citing this tool
Last updated . Add the date you accessed it as well, which a citation of a page that can change asks for. If a specific result matters, cite the permalink from the tool’s share row instead of this page: it reproduces the exact parameters.
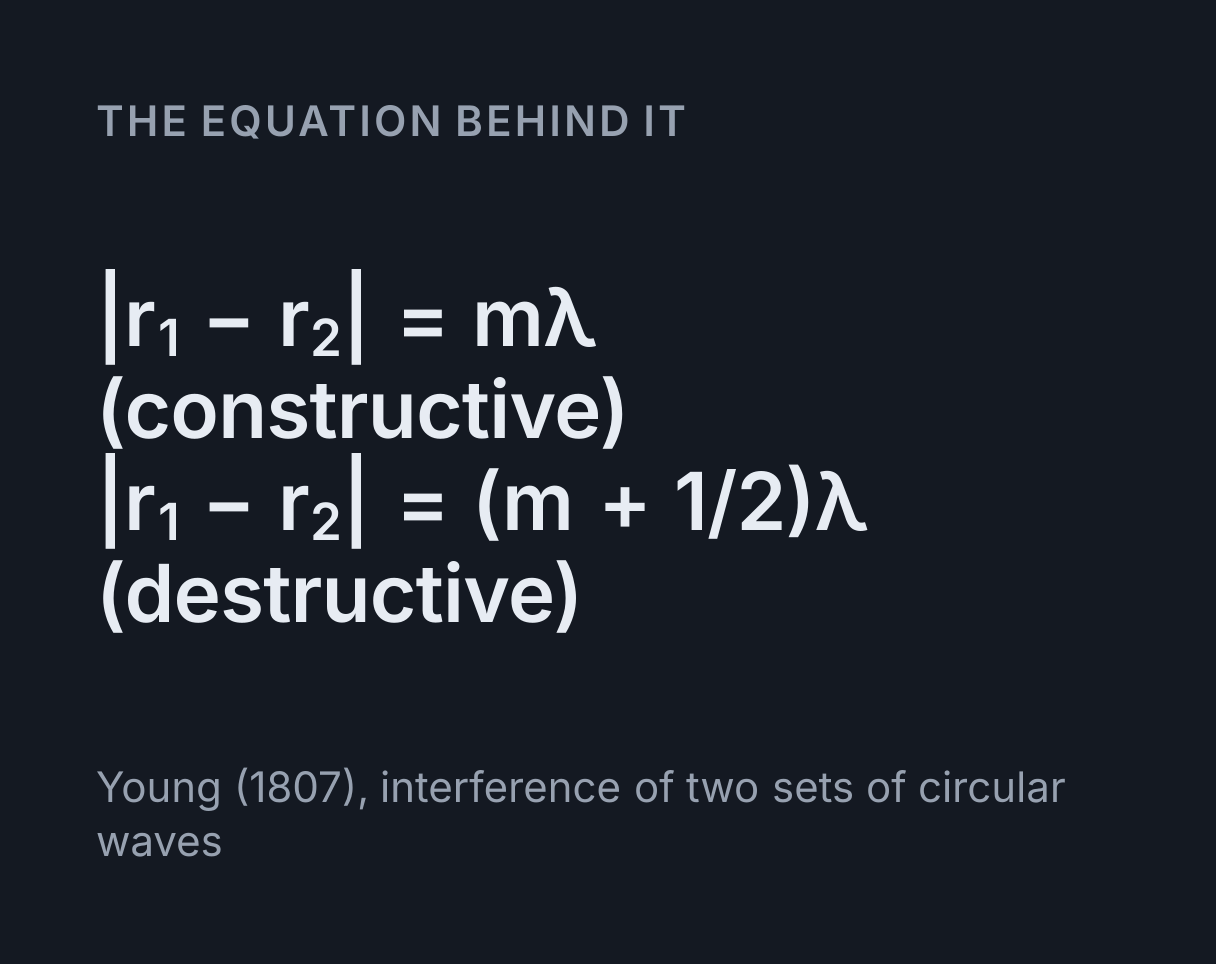
The equation
Young (1807), interference of two sets of circular waves
What is wave interference?
Wave interference is what happens where two waves overlap: their displacements add, so where
crest meets crest they reinforce and where crest meets trough they cancel. For two sources
vibrating in step, the path difference decides which. The waves reinforce where the distances to
the two sources differ by a whole number of wavelengths, |r₁ − r₂| = mλ, and cancel
where they differ by a whole number and a half, |r₁ − r₂| = (m + ½)λ, with m = 0, 1,
2 and so on.
This simulator works out the surface of a ripple tank from the two waves themselves and draws the nodal lines, where the waves cancel, from that condition alone. The calm bands in the moving ripples and the dashed curves are the same thing, which is the quickest way to see that the formula describes the tank rather than a diagram of it.
Reading the tank
S₁ and S₂ are the two sources, the separation d apart, and the legend gives the
colours for a crest and a trough. The dashed curves are the nodal lines; switch Lines drawn to
include the antinodal lines, where the waves arrive together, in between. The bar in the corner is
one wavelength to scale.
P is a probe. Drag it or use the arrow keys, and it reports its distances from the two sources,
r₁ and r₂, their difference in wavelengths, the phase difference that
makes, and how far the surface there swings as a share of what the two waves would give arriving
in step. The thin lines are the two paths, and the thick end of the longer one is the path
difference itself, drawn as a length you can hold against the wavelength bar.
The first plot is the two waves at the probe over two periods, with their sum. On a nodal line they arrive half a cycle apart and the sum is nearly flat. The second is the intensity along a line through the probe, parallel to the two sources, and the Amplitude view paints how far each point swings instead of where the ripples are at one instant.
Worked example: is the probe on a nodal line?
Take the defaults: 1.6 cm waves from two sources 6 cm apart in step, with the probe 6.3 cm straight out from S₁. S₁ sits at y = +3 cm and S₂ at y = −3 cm, and the probe at x = 6.3 cm, y = +3 cm.
- The two distances. The probe is level with S₁, so
r₁ = 6.3 cm. From S₂ it is 6.3 cm across and 6 cm up, sor₂ = √(6.3² + 6²) = √75.69 = 8.7 cm. - The path difference.
r₂ − r₁ = 8.7 − 6.3 = 2.4 cm, and2.4 / 1.6 = 1.5wavelengths. That is(m + ½)λwith m = 1, so the probe is on the second nodal line out from the centre on S₁’s side. - The phase difference. Each wavelength of path is 360°, so the waves arrive
1.5 × 360° = 540°apart, which is 180° once the whole cycle is taken out: every crest from one source arrives with a trough from the other. - How still it is. Two waves of equal amplitude would cancel exactly. Here each
amplitude falls as
1/√r, soa₂/a₁ = √(6.3/8.7) = 0.851and the surface still swings by(a₁ − a₂)/(a₁ + a₂) = 8.05percent ofa₁ + a₂, which is 0.65 percent of the in-step intensity. The Resultant amplitude readout gives the same 8.05. - Where the line goes. Far from the sources this nodal line runs straight, at an
angle to the centre line with
sin θ = 2.4/6 = 0.4, so θ = 23.6°. That is the double slit’s dark fringe condition,d sin θ = (m + ½)λ.
The same arithmetic answers the classic exam question of a detector carried straight out from
one of two loudspeakers. A point x out from S₁ is √(x² + d²) − x nearer S₁ than S₂, so
it is on the nodal line with path difference c where x = (d² − c²)/(2c). For the
four nodal lines on S₁’s side, c = 5.6, 4.0, 2.4 and 0.8 cm, the crossings are at x = 0.41, 2.5,
6.3 and 22.1 cm. Each is quieter than the last: the surface still swings by 23.4 percent of
a₁ + a₂ at 2.5 cm and by only 0.89 percent at 22.1 cm, because out there the two waves
have spread by almost the same amount.
Why the lines are hyperbolas
Every point on one nodal line is nearer one source than the other by the same distance, and that is the definition of a hyperbola with the two sources as its foci. Thomas Young described it for two stones thrown into a pond at the same instant, writing in 1807 that the smooth water lies along curves “of the kind denominated hyperbolas, each point of the curve being so situated with respect to its foci, as to be nearer to one than the other by a certain constant distance”.
Far from the sources a hyperbola straightens out along its asymptote, where
r₂ − r₁ = d sin θ. So the far end of this pattern is the fringe pattern of the
double slit simulator, with its bright fringes at
d sin θ = mλ. The difference is where you look: a screen a long way off sees only the
straight ends, while the tank shows the curved part near the sources as well.
Between the two sources the waves travel in opposite directions along the same line, and there the pattern is a standing wave, a partial one where the two amplitudes differ. The nodal lines cross the line joining the sources half a wavelength apart, at 0.4, 1.2, 2.0 and 2.8 cm either side of the midpoint at the defaults, just as the nodes on a string are half a wavelength apart in the standing wave simulator.
How many lines there are
For two sources in step, count the whole numbers m for which (m + ½)λ is no more
than the separation d. Each gives two nodal lines, one on each side of the centre line, so there are
twice the whole number part of d/λ + ½. The antinodal lines number one more than
twice the whole number part of d/λ, because the centre line is one of them. At the
defaults d/λ is 3.75, which gives 8 nodal lines and 7 antinodal lines.
No point can be nearer one source than the other by more than d, which is why the count stops. Sources closer together than half a wavelength leave no nodal line at all. And when a line’s path difference equals d exactly, it lies along the axis beyond the sources, where every point is the full separation nearer one source. The simulator counts those lines and says so, where the double slit simulator, whose fringes have to reach a screen, does not count a fringe at 90°.
When the sources are out of step
The phase lead control makes S₂ run ahead of S₁ in its cycle. The waves then arrive in step where
the path from S₂ is longer by just enough to make up the lead, so every line moves by
φ/360° of a wavelength of path difference, towards the source that lags. With S₂ a
quarter cycle ahead, the central antinodal line sits where r₂ − r₁ = λ/4, 0.4 cm at
the defaults, on S₁’s side.
Half a cycle apart, the conditions swap: the centre line becomes a nodal line, the waves reinforce
where |r₁ − r₂| = (m + ½)λ, and the defaults give 7 nodal lines and 8 antinodal ones.
A quarter cycle can also put lines on the axis. At the defaults with S₂ 90° ahead the whole axis
beyond S₁ is nodal and the axis beyond S₂ is antinodal, which is why the Lines readout then counts
8 of each.
Why a nodal line is never quite still
A circular wave spreads its energy round a circle that grows with distance, so its intensity falls
as 1/r and its amplitude as 1/√r. On a nodal line the two waves arrive
half a cycle apart, but the nearer source’s wave is the stronger, and what is left is the
difference, a₁ − a₂. That is why a real ripple tank shows calm bands rather than
perfectly still lines, calmest far from the sources where the two distances are nearly equal.
NCERT’s Physics Part II makes the same point in passing: its two amplitudes are only very nearly
equal where the distances are much greater than the separation.
Switch off Amplitude falls with distance and both waves keep the same amplitude everywhere. That is the textbook ideal, and the only case in which every nodal line reads 0 percent. The Amplitude view shows the difference most clearly: with spreading on, each nodal line is a narrow band of near stillness that fills in towards the sources, and with it off the band is still all the way.
Where the energy goes
Cancellation on a nodal line does not destroy the energy that would have arrived there. Two
sources with no fixed phase relation simply add intensities, a₁² + a₂², the dashed
curve on the intensity plot. Coherent sources add amplitudes, so the intensity is
a₁² + a₂² + 2a₁a₂ cos δ, with δ the phase difference. The last term is positive on
the antinodal lines and negative on the nodal lines, which is the solid curve swinging above and
below the dashed one. For equal amplitudes that is NCERT’s I = 4I₀ cos²(δ/2) against
2I₀ for sources that are not coherent.
The same numbers in decibels: on the centre line, where two equal loudspeakers in step are equally far away, the amplitude doubles and the intensity is four times that of one speaker, 6.0 dB more, while two unsynchronised speakers give twice the intensity, 3.0 dB more. The decibel calculator does that logarithm for any pair of intensities.
Any wave, any size
Only the ratios of lengths decide where the lines are, so the centimetres here can be read as
metres. Two loudspeakers 6 m apart playing a note with a 1.6 m wavelength put their nodal lines in
the same places, although sound spreads in three dimensions and its amplitude falls as
1/r rather than 1/√r. At 343 m/s, the speed of sound in air at 20 °C,
that note is 343/1.6 = 214 Hz, which the
wavelength and frequency calculator works out
from v = fλ. The pattern also depends on the two sources keeping exactly the same
frequency. Move one and the Doppler effect changes
the frequency its waves arrive with, and the lines no longer stand still.
What this model leaves out
It is a steady state: the sources have been running long enough to fill the surface, so there is no start-up transient and no wavefront still spreading. There are no walls, so no reflections, and no damping except the spreading, where real ripples also lose energy to the viscosity of the water.
The sources are points, and each wave is the circular wave a point source makes some way off. Within about a wavelength of a source a real wave differs from that: a quarter of a wavelength out, the exact solution for a point source on a surface is 1.8 percent weaker and 4 degrees out of phase. The path and phase differences are exact everywhere, and the simulator flags the amplitude as approximate when the probe is that close.
The ripples are small, so the two waves pass through each other unchanged and simply add. There is one frequency, so the speed of the waves never enters: centimetre ripples on water travel at a speed that depends on their wavelength, but at a single wavelength that changes nothing about where the lines are. For the same reason the clock is arbitrary, one wave period a second at 1x.
Common mistakes
- Starting m at 1. The first nodal line out from the centre has m = 0, a path
difference of half a wavelength. The centre line itself, with m = 0 in
mλ, is antinodal for sources in step. - Counting one side only. Nodal lines come in pairs, one either side of the centre line, so 4 values of m give 8 lines.
- Confusing path difference with phase difference. The path difference is a length; multiply it by 360°/λ, or 2π/λ, to get the phase difference.
- Forgetting the sources’ own phase. The conditions assume sources in step. Half a cycle apart they swap, and any other lead shifts every line.
- Using
d sin θnear the sources. It is the far-field limit of the hyperbolas. Close to the sources the lines curve and the angle depends on where you measure it. - Expecting complete silence on a nodal line. Only equal amplitudes cancel completely, and a wave from a nearer source is always the stronger.
Model and assumptions
- Method
- Exact expression, no time stepping
- Repeatability
- Deterministic. The same link gives the same numbers on any machine.
What it assumes
- Each source sends out circular waves of one wavelength, small enough to pass through each other unchanged, and the surface is their exact sum with time entering as a phase.
- Each wave’s amplitude falls as one over the square root of the distance, the far-field form of a point source on a surface, and is held at its quarter-wavelength value closer in.
- A steady state on an unbounded surface: no start-up transient, no reflections from the walls of a tank and no damping beyond the spreading.
- The nodal and antinodal lines are drawn from the path difference condition alone, as hyperbolas with the two sources at their foci, and are not traced from the picture.
Where it stops holding. Within about a wavelength of a source, where a real source’s wave is not yet the circular wave the model uses: a quarter of a wavelength out, the exact point-source wave differs from it by 1.8 percent in amplitude and 4 degrees in phase.
Numerical accuracy
No method error to report: the result is a closed-form expression evaluated directly, with no time stepping to accumulate error. What remains is double-precision rounding, of order one part in 10^16 per operation.
Common questions
What is the condition for constructive and destructive interference?
For two sources vibrating in step, the waves interfere constructively where the path difference is a whole number of wavelengths, |r₁ − r₂| = mλ, and destructively where it is a whole number and a half, |r₁ − r₂| = (m + ½)λ, with m = 0, 1, 2 and so on. Each wavelength of path difference is 360° of phase difference, so 1.5λ is 540°, which is 180° once the whole cycle is taken out: a crest arrives with a trough. If the sources are half a cycle apart, the two conditions swap.
Why are nodal lines hyperbolas?
Because every point on one nodal line is nearer one source than the other by the same distance, and the curve with that property is a hyperbola with the two sources as its foci. Thomas Young described exactly this in 1807 for two stones thrown into a pond at the same moment: the smooth water lies along hyperbolas. Far from the sources each one straightens out along the direction where d sin θ equals its path difference, which is why the double slit condition d sin θ = mλ describes the far end of the same pattern.
How many nodal lines are there between two sources?
For two sources in step, two for every whole number m with (m + ½)λ no more than the separation d, one on each side of the centre line. With the default 6 cm separation and 1.6 cm waves, d/λ is 3.75, so m can be 0, 1, 2 or 3 and there are 8 nodal lines, with 7 antinodal lines, one between each neighbouring pair. Sources closer together than half a wavelength have no nodal line at all. When (m + ½)λ equals d exactly, that pair lies along the axis, one beyond each source, and the simulator counts it.
What happens when the two sources are out of phase?
The whole pattern shifts towards the source that lags, because waves from the source that leads have to travel further to arrive in step. A lead of φ moves every line by φ/360° of a wavelength of path difference: with S₂ a quarter cycle ahead, the central antinodal line sits where r₂ − r₁ = λ/4, which is 0.4 cm at the default wavelength, on S₁’s side. Half a cycle apart, the conditions swap: the centre line becomes a nodal line and the waves reinforce where |r₁ − r₂| = (m + ½)λ.
Why is a nodal line in a real ripple tank not perfectly still?
Because the two waves meeting there have spread by different amounts, so they cannot cancel completely. Each wave’s amplitude falls as 1/√r as its energy spreads round a growing circle, so nearer S₁ the wave from S₁ is the stronger and what is left is the difference, a₁ − a₂. At the default probe, on a nodal line 6.3 cm from S₁ and 8.7 cm from S₂, the surface still swings by 8.05 percent of a₁ + a₂. Switch off Amplitude falls with distance to see the textbook ideal, in which every nodal line is perfectly still.