ECG Rhythm and Heart Block Simulator
ECG rhythm simulator: a sweeping lead II strip with a ladder diagram for sinus rhythm, heart blocks, atrial fibrillation, flutter, PACs and PVCs.
Simulator
Drag across the strip to measure an interval with calipers, or use the arrow keys to step beat by beat. Space plays and pauses.
Lead II rhythm strip at 25 mm/s and 10 mm/mV, with a ladder diagram of the atria, the AV node and the ventricles beneath it. Normal sinus rhythm. P waves at 75 a minute, each followed by a QRS complex after a PR interval of 160 ms. QRS 80 ms. Ventricular rate 75 a minute, regular.
Conducted Not conducted Ectopic or escape origin
- Ventricular rate 60 ÷ RR = 60 ÷ 0.8 s. On the paper, 1500 ÷ the 20 small squares from one R wave to the next.
- 75 bpm
- Atrial rate P waves a minute, 60 ÷ PP = 60 ÷ 0.8 s.
- 75 bpm
- AV conduction Every P wave is followed by a QRS complex.
- 1:1
- PR interval Start of the P wave to the start of the QRS: 160 ms, 4 small squares. Normal is 120 to 200 ms.
- 160 ms
- QRS duration 2 small squares. Under 120 ms is narrow; 120 ms or more is wide, as in a bundle branch block or a beat that starts in the ventricles.
- 80 ms
- QT interval Bazett’s formula run back from a QTc of 400 ms at the average RR: QT = 0.40 × √0.8 = 0.3578 s.
- 357.8 ms
- QTc, Bazett QT ÷ √RR, Bazett’s correction to 60 bpm. It is 400 ms when the QRS is 80 ms wide; a wider QRS adds its extra width to the QT and reads longer, and a narrower one reads shorter.
- 400 ms
- RR interval Start of one QRS to the start of the next: 800 ms, 20 small squares.
- 800 ms
- Regularity Every RR interval is the same.
- Regular
A teaching model of textbook rhythms, drawn from a timetable rather than recorded from a heart. It is not a diagnostic tool and cannot interpret a real ECG.
- RR interval
- PR interval
- PP interval
Citing this tool
Last updated . Add the date you accessed it as well, which a citation of a page that can change asks for. If a specific result matters, cite the permalink from the tool’s share row instead of this page: it reproduces the exact parameters.
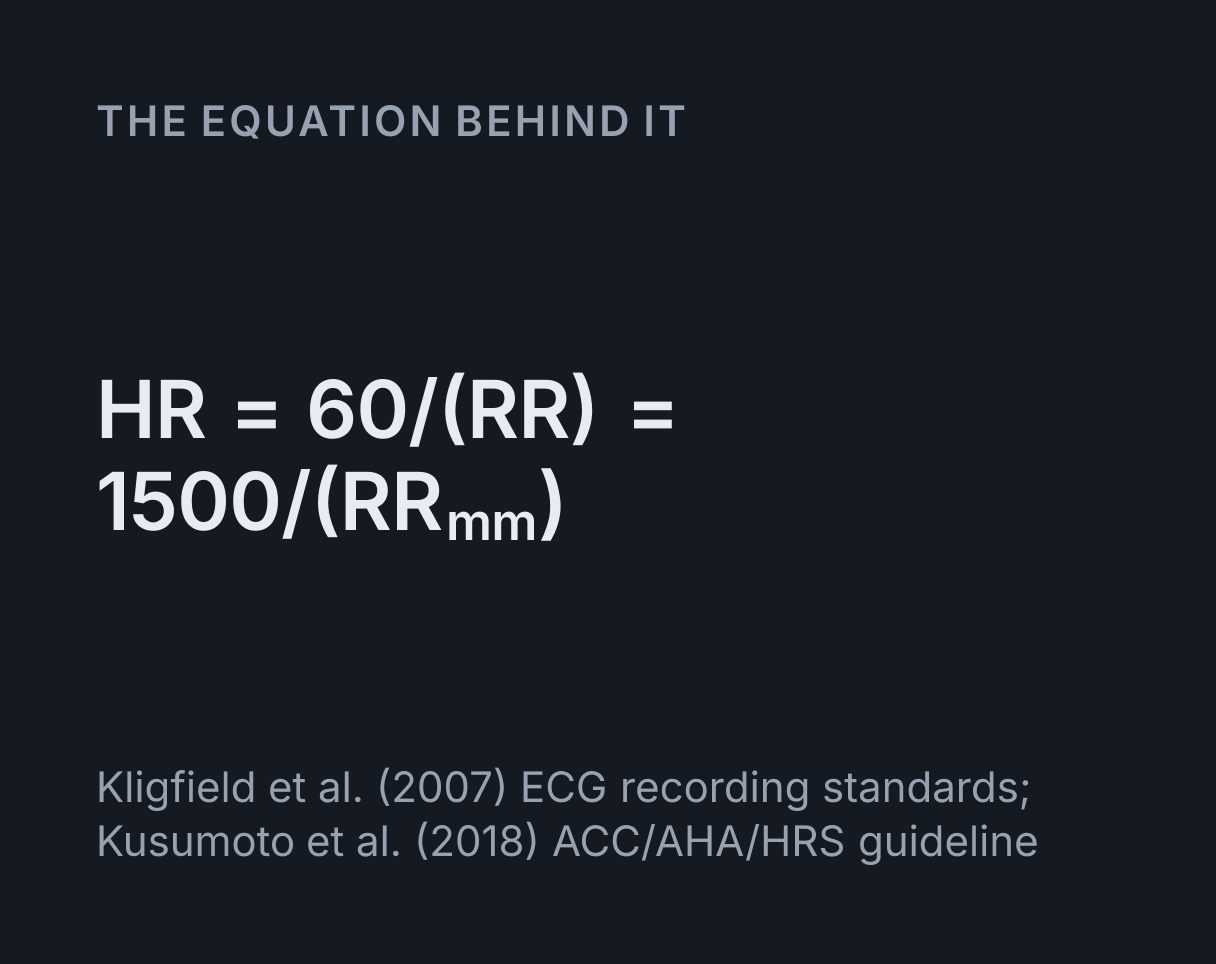
The equation
Kligfield et al. (2007) ECG recording standards; Kusumoto et al. (2018) ACC/AHA/HRS guideline
What is an ECG rhythm simulator?
An ECG rhythm simulator draws a rhythm strip from a known timetable of heartbeats, so you can
watch each rhythm form and measure it the way you would measure a real tracing. This one draws
lead II on standard paper, at 25 mm/s and 10 mm/mV, for normal sinus rhythm, sinus bradycardia
and tachycardia, first-degree, second-degree and complete heart block, atrial fibrillation,
atrial flutter, and premature atrial and ventricular complexes. A ladder diagram under the strip
follows every impulse from the atria, through or into the AV node, to the ventricles. The first
number to read from any strip is the rate, HR = 60 / RR, which at the standard
paper speed becomes HR = 1500 / small squares between two R waves.
It is a teaching model of textbook rhythms, not a diagnostic tool, and it cannot interpret a real ECG. The patterns follow the definitions of the 2018 ACC/AHA/HRS bradycardia guideline by Kusumoto and colleagues, and the waves are the ones the cardiac cycle simulator draws under its Wiggers diagram, so the two tools show the same beat.
Reading ECG paper
At 25 mm/s each small square, 1 mm, is 1 / 25 = 0.04 s, and each large square of
five small ones is 5 × 0.04 = 0.2 s. Vertically, at 10 mm/mV, a small square is
0.1 mV and a large one 0.5 mV. The step at the start of each row is the calibration pulse, 1 mV
drawn 10 mm high and 0.2 s wide, the check that the gain and the speed are standard. Five large
squares make a second, so a 6 second strip is 30
large squares long.
Rates come from the spacing of the R waves. With the RR interval in large squares the rate is
300 / large squares, and in small squares it is 1500 / small squares.
Both are 60 seconds divided by the interval, because a minute of paper is 300 large squares or
1500 small ones. When the rhythm is irregular no single interval stands for the rate, so count
the QRS complexes in 6 seconds and multiply by 10.
Using the simulator
Choose a rhythm from the menu. The fields below it change to the ones that rhythm uses, each limited to the values its definition allows: sinus bradycardia goes no higher than 59, and first-degree block no lower than a PR of 210 ms. Press Play and the strip sweeps from left to right in real time, as a bedside monitor does, writing over the previous sweep a few squares ahead of the cursor. The paper holds two rows, read like lines of text. The scrubber moves through the minute by hand, and the speed menu slows the sweep to a tenth of real time.
Two tools work on the strip itself. Drag across it and calipers read the distance as time, small squares and a rate, the way you would march out P waves on paper; or select it and step one beat at a time with the arrow keys, and the line under the rhythm’s name gives that beat’s PR and RR. Triangles along the top of the paper mark every P wave or flutter wave, in the conducted colour when it reached the ventricles.
The readouts give the rates, the conduction ratio, the PR, QRS, QT and QTc, the RR range and the regularity. The plot draws every RR, PR and PP interval of the minute, where Wenckebach’s staircase and the scatter of atrial fibrillation are easiest to see.
Worked example: normal sinus rhythm at 75 bpm
The simulator opens on normal sinus rhythm at 75 beats a minute, with a PR interval of 160 ms and a QRS of 80 ms. A reader measures what the readouts show:
-
RR interval:
60 / 75 = 0.8 s, which is0.8 / 0.04 = 20small squares, or 4 large ones. - Rate from the paper:
300 / 4 = 75or1500 / 20 = 75beats a minute. -
PR interval: 160 ms,
0.16 / 0.04 = 4small squares, inside the normal 120 to 200 ms. - QRS: 80 ms, 2 small squares, narrow because it is under 120 ms.
-
QT: Bazett’s formula with a corrected QT of 400 ms gives
QT = 0.40 × √0.8 = 0.3578 s, just under 9 small squares, and correcting it back givesQTc = 0.3578 / √0.8 = 0.400 s. -
The 6 second count: the first QRS starts at 0.36 s, so the first 6 seconds hold 8 of them and
8 × 10 = 80. The method counts whole complexes, so it is good only to about 10 beats a minute.
Every P wave is upright and followed by a QRS after the same PR, the rate is between 60 and 100, and every RR interval is the same: normal sinus rhythm. Pick sinus bradycardia and the rate drops to 50, below the conventional 60; pick sinus tachycardia and it rises to 120. The QTc calculator goes further into the QT, comparing Bazett’s correction with three others at any rate.
Reading the ladder diagram
A ladder diagram, also called a Lewis diagram after the cardiologist Thomas Lewis, draws conduction against the same time axis as the strip. The top tier, A, is the atria; the middle tier, AV, is the AV node and the bundle of His; the bottom tier, V, is the ventricles. A sinus impulse is a short line across the A tier at the start of its P wave, a sloping line through the AV tier, and a line across the V tier at the start of its QRS. The slope through the AV tier is the PR interval, written beside it in ms where there is room, so a long PR draws a shallow line.
An impulse that is not conducted stops partway through the AV tier with a short bar across its end. Where it stops follows where the block usually is: halfway down for a block in the AV node, as in Mobitz I, and near the bottom for a block below it, as in Mobitz II. A dot marks a beat that starts somewhere other than the sinus node: in the A tier for a premature atrial complex, in the V tier for a premature ventricular complex or a ventricular escape beat, and at the foot of the AV tier for a junctional escape beat. A line from such a dot back towards the atria that ends in a bar is retrograde conduction that went nowhere.
First-degree AV block and Mobitz I
In first-degree AV block every P wave is conducted, but slowly: the PR is longer than 200 ms, one large square, and the same in every beat. Nothing is dropped, so the rhythm stays regular at the sinus rate. The simulator opens it at a PR of 280 ms, 7 small squares.
Second-degree AV block means some P waves are not followed by a QRS. In Mobitz type I, also called Wenckebach, the PR lengthens from beat to beat until one P wave is not conducted, and the cycle starts again from the shortest PR. Pick Mobitz I from the opening settings and the groups are 4:3, four P waves for three QRS complexes:
-
PR intervals: 160,
160 + 80 = 240and240 + 40 = 280ms, and then a P wave with no QRS. -
RR intervals: each is the PP interval plus that step in the PR,
800 + 80 = 880and800 + 40 = 840ms, so they shorten towards the pause. -
The pause around the dropped beat:
2 × 800 − (280 − 160) = 1480 ms, less than two PP intervals. -
Ventricular rate: three QRS complexes every 3.2 s, so
75 × 3 / 4 = 56.25beats a minute.
Those three signs, the shortening RR, the pause shorter than two cycles and the beats arriving in groups, are the footprints of typical Wenckebach periodicity. The block is usually in the AV node, and Mobitz I is common in healthy athletes and during sleep, when vagal tone is high.
Mobitz II, 2:1 block and complete heart block
In Mobitz type II the PR is the same before and after the P wave that is not conducted. The
block is usually below the AV node, in the His-Purkinje system, the QRS is often wide from a
bundle branch block that comes with it, and it can progress without warning to complete heart
block. That is why the 2018 guideline recommends a permanent pacemaker for acquired Mobitz II
that has no reversible cause. At 4:3 from the opening settings the RR intervals are 800, 800 and
then exactly 2 × 800 = 1600 ms across the dropped beat. Widen the QRS to 120 ms or
more to see the pattern it most often comes with.
When every second P wave is dropped the strip shows 2:1 block, and there is no pair of conducted PR intervals in a row to compare, so it cannot be called type I or type II from the strip alone. A narrow QRS points to the AV node and a wide one to the conduction system below it, which is how the ladder decides where to draw the block.
In third-degree, or complete, heart block no P wave is conducted at all. The P waves keep the sinus rate, a slower escape rhythm drives the ventricles, and the two are unrelated: march out the P waves and they pass straight through the QRS complexes and T waves. From the opening settings the atria run at 75 and a junctional escape at 44, with a narrow QRS; a ventricular escape, typically 20 to 40 a minute, has a wide QRS and a T wave pointing the other way. Heart block after an inferior heart attack is usually at the AV node, because in most people the artery to the AV node branches from the right coronary artery, which you can trace in the heart explorer.
Atrial fibrillation and atrial flutter
Atrial fibrillation has no P waves. The atria fire chaotically at 350 to 600 a minute, which shows
as a fine irregular baseline, and the AV node passes whichever impulse reaches it once it has
recovered, so the RR intervals are irregularly irregular. The model makes each RR interval the
node’s refractory period plus a random wait for the next impulse: at the opening rate of 100 a
minute the mean RR is 60 / 100 = 0.6 s and the refractory period is
0.6 − 0.15 = 0.45 s, so no RR interval is shorter than 450 ms. The 2020 ESC
guideline counts an episode as clinical atrial fibrillation once it lasts at least 30 seconds on
an ECG.
Atrial flutter is a single wave of activation circling the right atrium at about 300 a minute,
which draws the negative sawtooth flutter waves best seen in leads II, III and aVF. The AV node
cannot follow every wave, so it conducts a fixed share of them: at 300 a minute, 2:1 conduction
gives 300 / 2 = 150 and 4:1 gives 300 / 4 = 75 beats a minute, both
regular. Rate-control drugs such as beta
blockers and digoxin slow conduction through the AV node, and the
pharmacokinetics simulator shows how a drug’s
level rises and settles with repeated doses.
Premature beats and the compensatory pause
A premature atrial complex, or PAC, is an early P wave of a different shape, conducted to a
normal QRS. It enters the sinus node and resets it, so the next sinus P wave comes one sinus cycle
later. From the opening settings, with a PAC every fourth beat at 65 percent of the cycle, the PAC
comes 0.65 × 800 = 520 ms after the P wave before it, and the QRS complexes either
side of it are 520 + 800 = 1320 ms apart, less than two cycles: the pause is not
compensatory.
A premature ventricular complex, or PVC, also called a premature ventricular contraction, is a
wide QRS with no P wave before it and a T wave pointing the other way. It does not reset the
sinus node. The next sinus P wave arrives on time, finds the AV node still refractory and is
hidden in the PVC, so the QRS complexes either side of it are exactly two cycles apart:
520 + 1080 = 1600 ms, the full compensatory pause. One PVC in every two beats is
ventricular bigeminy and one in three is trigeminy. A PVC early enough to land on the T wave of
the beat before, R on T, is the timing linked with ventricular tachycardia and fibrillation in a
vulnerable heart.
What this model leaves out
- Real physiology. Every rhythm is a timetable with fixed intervals, the same for the whole minute. A real sinus rate varies with breathing, so even a normal strip shows some sinus arrhythmia, a real PR and QT change with autonomic tone and drugs, and a real block can come and go.
- Other leads. Only lead II is drawn, so the axis, the shapes of bundle branch block and ST changes, which need a 12-lead ECG, are not shown.
- Atypical patterns. The PR steps in Mobitz I always halve here; in long groups they often do not, and the RR intervals then fail to shorten. PVCs are never interpolated, PACs are never blocked or conducted aberrantly, and there are no fusion beats.
- Fast arrhythmias. Supraventricular tachycardia, ventricular tachycardia, ventricular fibrillation and pre-excitation are not modelled.
Common mistakes
- Calling 2:1 block Mobitz II. With no two conducted beats in a row, the PR cannot be seen to lengthen or to stay the same, so 2:1 block is a category of its own.
- Missing hidden P waves. P waves land on T waves in sinus tachycardia, in complete heart block and after a PVC. March them out with calipers from the ones you can see.
- Taking a regular rhythm near 150 for sinus tachycardia. It is often atrial flutter with 2:1 conduction.
- Forgetting the paper speed. At 50 mm/s, used in some countries, every square is half the time, and a rate read with the 25 mm/s rules comes out at half the true rate.
- Correcting the QT of a wide QRS as if it were narrow. A bundle branch block adds its extra width to the QT, so the QTc reads long even when repolarisation is normal.
Model and assumptions
- Method
- Exact expression, no time stepping
- Repeatability
- Deterministic. The same link gives the same numbers on any machine.
What it assumes
- Every rhythm is a repeating timetable of atrial and ventricular activations worked out in closed form from the settings, so the strip, the ladder diagram and every readout are exact functions of time with nothing stepped.
- The P, QRS and T waves are the Gaussian waves of the cardiac cycle model, after McSharry et al. (2003), with the QT from Bazett’s formula at a corrected QT of 400 ms and the rhythm’s average cycle length.
- Mobitz I lengthens the PR by a set step on the second beat of each group and by half the previous step on each beat after it, while Mobitz II and 2:1 block keep the PR constant.
- In atrial fibrillation each RR interval is the AV node’s refractory period plus an exponential wait for the next fibrillatory impulse, taken from a fixed seeded sequence and scaled so the minute holds exactly the set number of beats, so the same link always draws the same strip.
- A premature atrial complex resets the sinus node, so the next P wave comes one sinus cycle later, and a premature ventricular complex blocks the sinus P wave after it, which gives the full compensatory pause.
Where it stops holding. Real tracings, whose intervals vary with breathing, autonomic tone, drugs and disease, whose ectopic beats can be interpolated, blocked or conducted aberrantly, and whose QT has to be measured from the strip and corrected for the rate rather than read off a formula. The QTc Calculator is the right tool there.
Numerical accuracy
No method error to report: the result is a closed-form expression evaluated directly, with no time stepping to accumulate error. What remains is double-precision rounding, of order one part in 10^16 per operation.
Common questions
What is the difference between Mobitz type 1 and Mobitz type 2 heart block?
Both are second-degree AV block, in which some P waves are not followed by a QRS complex. In Mobitz type 1, or Wenckebach, the PR interval lengthens from beat to beat until a P wave is not conducted, and the PR after the pause is the shortest; the block is usually in the AV node and is often benign. In Mobitz type 2 the PR stays the same in every conducted beat until a P wave suddenly fails to conduct; the block is usually below the AV node, often with a wide QRS, and can progress to complete heart block, which is why the 2018 ACC/AHA/HRS guideline recommends a permanent pacemaker for acquired Mobitz type 2 with no reversible cause. At 75 P waves a minute with 4:3 conduction both give 56.25 QRS complexes a minute, so the rate alone cannot tell them apart.
What does first-degree heart block look like on an ECG?
Every P wave is followed by a QRS complex, but the PR interval is longer than 200 ms, one large square at 25 mm/s, and it is the same in every beat. No beat is dropped, so the rhythm is regular and the rate is the sinus rate. The simulator opens it at a PR of 280 ms, seven small squares, against a normal 120 to 200 ms. It means conduction, usually through the AV node, is slow rather than failing, and on its own it rarely causes symptoms.
How do you recognise complete heart block on an ECG?
The P waves and the QRS complexes each keep their own regular rate, with no fixed relationship between them. March the P waves out with calipers and they pass straight through the QRS complexes and T waves, so the gap from a P wave to the next QRS changes from beat to beat. The atrial rate is faster than the ventricular rate, which is set by an escape rhythm: typically 40 to 60 a minute with a narrow QRS from the AV junction, or 20 to 40 with a wide QRS from the ventricles. From the opening settings the simulator runs the atria at 75 and a junctional escape at 44.
How do you tell atrial fibrillation from atrial flutter on an ECG?
Look at the baseline and the spacing of the QRS complexes. Atrial fibrillation has no P waves, only an irregular fibrillatory baseline, and its RR intervals are irregularly irregular, with no pattern at all. Atrial flutter has regular sawtooth flutter waves at about 300 a minute, best seen in leads II, III and aVF, and the AV node passes a fixed share of them, so the ventricular rhythm is usually regular: 150 a minute at 2:1 conduction and 75 at 4:1. A regular narrow-complex rhythm at about 150 should always prompt a look for flutter waves hidden in the QRS complexes and T waves.
How do you calculate heart rate from an ECG strip?
At the standard paper speed of 25 mm/s, divide 300 by the number of large squares between two R waves, or 1500 by the number of small squares. An RR interval of 4 large squares, 20 small ones, is 0.8 s, so the rate is 300 ÷ 4 = 75 or 1500 ÷ 20 = 75 beats a minute. For an irregular rhythm such as atrial fibrillation, count the QRS complexes in a 6 second strip and multiply by 10, which gives the average rate to within about 10 beats a minute.
What heart rate counts as sinus bradycardia or sinus tachycardia?
Conventionally, sinus rhythm below 60 beats a minute is sinus bradycardia and above 100 is sinus tachycardia, with every P wave upright in lead II and followed by a QRS complex. The 2018 ACC/AHA/HRS bradycardia guideline defines sinus bradycardia as below 50 instead, and resting rates in the 50s are common in fit adults and during sleep. The simulator uses the conventional 60 and 100, and opens sinus bradycardia at 50 and sinus tachycardia at 120.