Simpson’s Diversity Index Calculator
Simpson’s diversity index calculator for up to twelve species: D, 1 − D and 1/D with full working, Shannon’s H′, evenness and two habitats compared.
Calculator
- 1 − D, Mixed wood Simpson’s index of diversity, 1 − Σn(n − 1) ÷ N(N − 1): the chance that two individuals picked at random belong to different species. It is 0 for a single species and rises towards 1.
- 0.7927
- 1 − D, Birch wood Simpson’s index of diversity, 1 − Σn(n − 1) ÷ N(N − 1): the chance that two individuals picked at random belong to different species. It is 0 for a single species and rises towards 1.
- 0.3551
- D, Mixed wood Simpson’s index, D = Σn(n − 1) ÷ N(N − 1): the chance that two individuals picked at random, without replacement, belong to the same species. Lower means more diverse.
- 0.2073
- D, Birch wood Simpson’s index, D = Σn(n − 1) ÷ N(N − 1): the chance that two individuals picked at random, without replacement, belong to the same species. Lower means more diverse.
- 0.6449
- 1/D, Mixed wood The reciprocal index, 1/D = N(N − 1) ÷ Σn(n − 1), which AQA calls the index of diversity, d. It is 1 for a single species and rises with diversity.
- 4.823
- 1/D, Birch wood The reciprocal index, 1/D = N(N − 1) ÷ Σn(n − 1), which AQA calls the index of diversity, d. It is 1 for a single species and rises with diversity.
- 1.551
Mixed wood is the more diverse of the two by both indices: 1 − D is 0.7927 against 0.3551, and H′ is 1.549 against 0.7564.
| Index | Mixed wood | Birch wood |
|---|---|---|
| Individuals, N | 50 | 50 |
| Species present, S | 5 | 5 |
| Σn(n − 1) | 508 | 1580 |
| N(N − 1) | 2450 | 2450 |
| Simpson’s index, D | 0.2073 | 0.6449 |
| Index of diversity, 1 − D | 0.7927 | 0.3551 |
| Reciprocal index, 1/D | 4.823 | 1.551 |
| Σ(n/N)² | 0.2232 | 0.652 |
| 1 − Σ(n/N)² | 0.7768 | 0.348 |
| 1/Σ(n/N)² | 4.48 | 1.534 |
| Shannon’s H′, ln | 1.549 | 0.7564 |
| Pielou’s evenness, J′ | 0.9625 | 0.47 |
Each bar is a species’ share of its own habitat’s individuals, all drawn to one scale, with the count and percentage beside it. Bars of similar length mean an even habitat; one long bar means a habitat dominated by one species.
| Species | n | n(n − 1) | p = n/N | p² | −p ln p |
|---|---|---|---|---|---|
| Birch | 10 | 90 | 0.2 | 0.04 | 0.3219 |
| Oak | 15 | 210 | 0.3 | 0.09 | 0.3612 |
| Ash | 12 | 132 | 0.24 | 0.0576 | 0.3425 |
| Rowan | 8 | 56 | 0.16 | 0.0256 | 0.2932 |
| Holly | 5 | 20 | 0.1 | 0.01 | 0.2303 |
| Total | 50 | 508 | 1 | 0.2232 | 1.549 |
Working, Mixed wood
- S = 5 species
- N = 10 + 15 + 12 + 8 + 5 = 50
- Σn(n - 1) = 10 x 9 + 15 x 14 + 12 x 11 + 8 x 7 + 5 x 4 = 90 + 210 + 132 + 56 + 20 = 508
- N(N - 1) = 50 x 49 = 2450
- D = 508 / 2450 = 0.20735
- 1 - D = 1 - 0.20735 = 0.79265
- 1/D = 2450 / 508 = 4.8228
- Σn² = 10^2 + 15^2 + 12^2 + 8^2 + 5^2 = 100 + 225 + 144 + 64 + 25 = 558
- Σ(n/N)² = 558 / 50^2 = 0.2232
- 1 - Σ(n/N)² = 1 - 0.2232 = 0.7768
- 1/Σ(n/N)² = 50^2 / 558 = 4.4803
- H′ = -(0.2 x ln(0.2) + 0.3 x ln(0.3) + 0.24 x ln(0.24) + 0.16 x ln(0.16) + 0.1 x ln(0.1)) = 1.5491
- J′ = 1.5491 / ln(5) = 0.96248
n(n − 1) counts the ordered pairs of two different individuals of one species and N(N − 1) every such pair in the habitat, so D is the chance that a pair picked at random belongs to one species.
| Species | n | n(n − 1) | p = n/N | p² | −p ln p |
|---|---|---|---|---|---|
| Birch | 40 | 1560 | 0.8 | 0.64 | 0.1785 |
| Oak | 4 | 12 | 0.08 | 0.0064 | 0.2021 |
| Ash | 3 | 6 | 0.06 | 0.0036 | 0.1688 |
| Rowan | 2 | 2 | 0.04 | 0.0016 | 0.1288 |
| Holly | 1 | 0 | 0.02 | 0.0004 | 0.07824 |
| Total | 50 | 1580 | 1 | 0.652 | 0.7564 |
Working, Birch wood
- S = 5 species
- N = 40 + 4 + 3 + 2 + 1 = 50
- Σn(n - 1) = 40 x 39 + 4 x 3 + 3 x 2 + 2 x 1 + 1 x 0 = 1560 + 12 + 6 + 2 + 0 = 1580
- N(N - 1) = 50 x 49 = 2450
- D = 1580 / 2450 = 0.6449
- 1 - D = 1 - 0.6449 = 0.3551
- 1/D = 2450 / 1580 = 1.5506
- Σn² = 40^2 + 4^2 + 3^2 + 2^2 + 1^2 = 1600 + 16 + 9 + 4 + 1 = 1630
- Σ(n/N)² = 1630 / 50^2 = 0.652
- 1 - Σ(n/N)² = 1 - 0.652 = 0.348
- 1/Σ(n/N)² = 50^2 / 1630 = 1.5337
- H′ = -(0.8 x ln(0.8) + 0.08 x ln(0.08) + 0.06 x ln(0.06) + 0.04 x ln(0.04) + 0.02 x ln(0.02)) = 0.75637
- J′ = 0.75637 / ln(5) = 0.46996
n(n − 1) counts the ordered pairs of two different individuals of one species and N(N − 1) every such pair in the habitat, so D is the chance that a pair picked at random belongs to one species.
Citing this tool
Last updated . Add the date you accessed it as well, which a citation of a page that can change asks for. If a specific result matters, cite the permalink from the tool’s share row instead of this page: it reproduces the exact parameters.
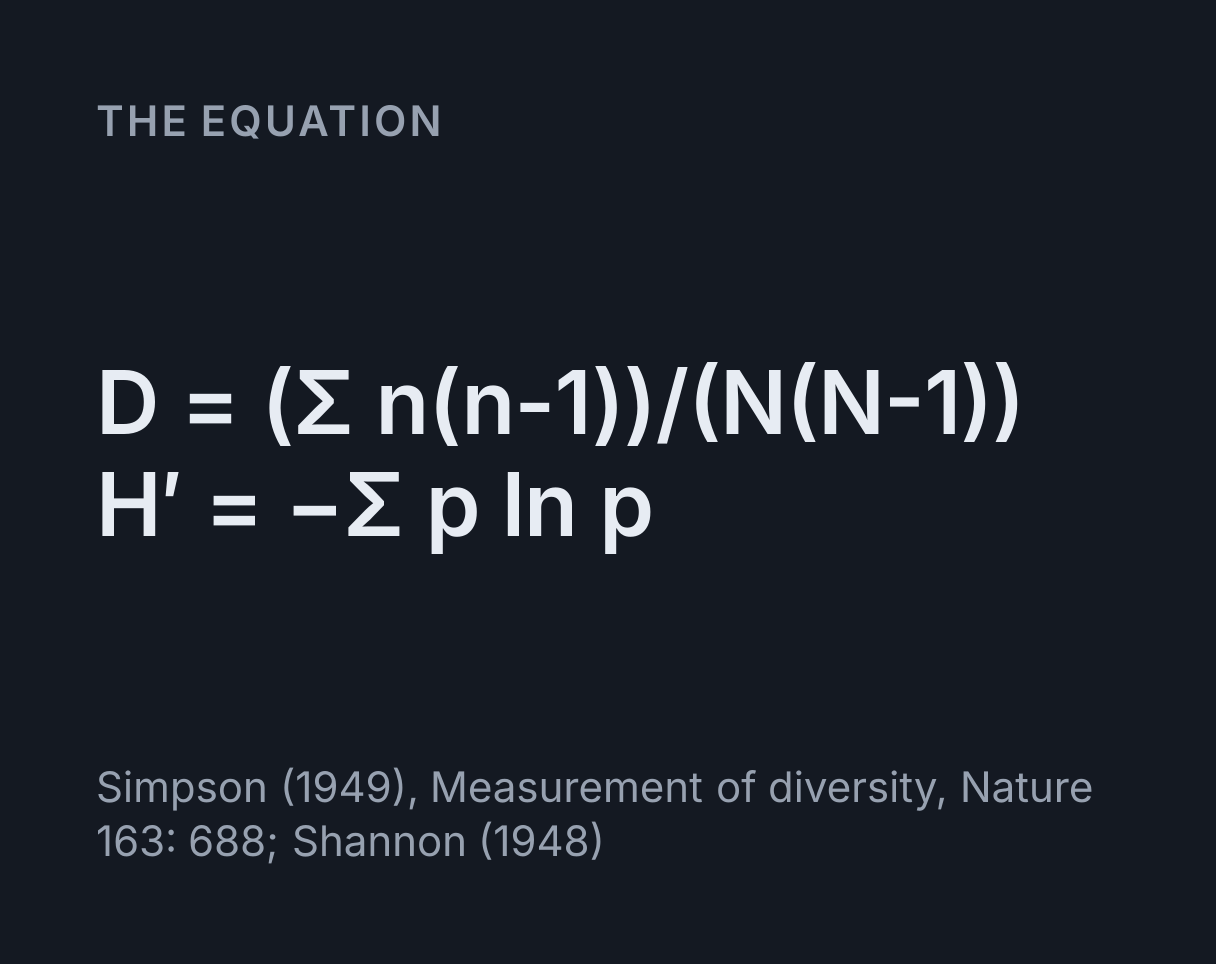
The equation
Simpson (1949), Measurement of diversity, Nature 163: 688; Shannon (1948)
What is Simpson’s diversity index?
Simpson’s diversity index measures how varied a community is from a count of the individuals
of each species. Its basic form is D = Σn(n − 1) ÷ N(N − 1), where n is the number
of individuals of one species and N the total of all species. D is the probability that two
individuals picked at random, without replacement, belong to the same species, so it runs from
0 to 1 and falls as diversity rises. Courses therefore usually quote 1 − D, Simpson’s
index of diversity, which is the chance that the two belong to different species, or the
reciprocal index 1/D, which is 1 for a single species and rises with diversity.
The index rewards two things at once: more species, which is richness, and individuals spread more evenly among them, which is evenness. E. H. Simpson set it out in Nature in 1949. This calculator works out D, 1 − D and 1/D for up to twelve species, with the Σ(n/N)² form some exam boards use, Shannon’s index and evenness, for one habitat or for two side by side.
Using the calculator
Type a name and a count for each species, one row per species, and add rows up to twelve. Counts are whole numbers of individuals. With Compare a second habitat ticked, every row takes a second count, so both habitats share one species list and a species missing from one of them is entered as 0. Untick it to work with a single habitat.
The readouts give the three Simpson forms, and the table beneath them lists every figure for each habitat, including the sums Σn(n − 1) and N(N − 1) that the indices are built from. The bar chart draws each species’ share of its own habitat on one scale, which makes evenness visible: bars of similar length mean an even habitat. Below that, each habitat gets its working, a species-by-species table of n, n(n − 1), p, p² and −p ln p, the columns an exam answer uses, followed by every division written out. The link in the share row reopens the whole table.
Worked example: two woods with the same five species
The calculator opens on made-up counts of 50 trees in each of two woods, chosen so the arithmetic is easy to follow. The mixed wood has 10 birch, 15 oak, 12 ash, 8 rowan and 5 holly.
N = 10 + 15 + 12 + 8 + 5 = 50-
Σn(n − 1) = 10 × 9 + 15 × 14 + 12 × 11 + 8 × 7 + 5 × 4 = 90 + 210 + 132 + 56 + 20 = 508 N(N − 1) = 50 × 49 = 2,450D = 508 ÷ 2,450 = 0.20731 − D = 0.7927, and1/D = 2,450 ÷ 508 = 4.823
The birch wood holds the same five species, but 40 of its 50 trees are birch and the other
species have 4, 3, 2 and 1. Its Σn(n − 1) = 1,560 + 12 + 6 + 2 + 0 = 1,580, so
D = 1,580 ÷ 2,450 = 0.6449, 1 − D = 0.3551 and 1/D = 1.551.
Species richness and sample size cannot tell the two woods apart, yet the mixed wood’s index of
diversity is more than twice the birch wood’s. Four trees in five being birch is what pulls the
second wood down: a pair picked there is usually two birches.
D, 1 − D or 1/D: which one your course uses
The three forms carry the same information on different scales, and the letters are not used
consistently, so check the formula rather than the name. AQA’s index of diversity,
d = N(N − 1) ÷ Σn(n − 1), is the reciprocal 1/D, which is 4.823 for the mixed wood.
OCR writes Simpson’s index of diversity as D = 1 − Σ(n/N)², squaring each
species’ share of the total instead of using n(n − 1). That picks the two individuals with
replacement, as though the first were put back before the second is drawn, and it is the form
Simpson gave for a whole population; the n(n − 1) form is his estimate of it from a sample.
The two are tied exactly by 1 − D = (1 − Σ(n/N)²) × N ÷ (N − 1). For the mixed
wood, Σ(n/N)² = 558 ÷ 2,500 = 0.2232, so the squared form gives 0.7768, and
0.7768 × 50 ÷ 49 = 0.7927. The gap is about 2 percent at 50 individuals and shrinks
as samples grow, but when two habitats were sampled to very different sizes the forms can rank
them differently. The calculator shows both, and says so when that happens.
Shannon’s index and evenness
Shannon’s index, H′ = −Σ p ln p with p = n ÷ N, comes from Claude
Shannon’s 1948 measure of information and is the other diversity index in wide use. It is 0
for a single species and reaches ln S when all S species are equally common, so dividing
by that ceiling gives Pielou’s evenness, J′ = H′ ÷ ln S, which runs from 0 to 1.
For the mixed wood H′ = 1.549 and J′ = 1.549 ÷ ln 5 = 0.962, close to
perfectly even, while the birch wood gives H′ = 0.756 and J′ = 0.470.
The two indices weight species differently. Simpson’s is dominated by the commonest species, while Shannon’s gives rare ones more weight, so a habitat with several rare extras can lead on H′ while another, more even among its common species, leads on 1 − D. They agree about the two woods, and when they disagree the calculator says so. H′ also depends on the logarithm: it uses ln unless you switch to base 2, which gives H′ in bits, or base 10. Evenness comes out the same in any base.
What this calculator leaves out
- Sampling effort. Every index here depends on how hard you looked, because a bigger sample turns up more rare species. Compare habitats sampled the same way, with the same number of quadrats, traps or minutes of searching.
- A significance test. An index has no p-value of its own; Hutcheson’s t-test (1970) is a common way to compare two Shannon indices. To ask whether two habitats hold their species in different proportions, enter the same counts in the chi-square calculator as a species-by-habitat contingency table. The two woods give χ² = 36.04 on 4 degrees of freedom, with p below 0.001, if each tree is treated as an independent observation.
- Population size. The indices describe a sample, not how many individuals live in the habitat. To estimate a population of animals from a sample, use the mark-recapture calculator.
- Which species they are. Two habitats with no species in common can score the same, and a rare or protected species counts for no more than a common one.
- Diversity within a species. Genetic diversity is measured from allele and genotype frequencies, as in the Hardy-Weinberg calculator, not from counts of species.
- Percentage cover. n(n − 1) needs whole individuals. For cover or biomass, enter the values as whole numbers and read only 1 − Σ(n/N)² and H′, which depend on nothing but each species’ share.
- Change over time. An index is a snapshot. How two populations rise and fall together is the subject of the predator-prey simulator.
Common mistakes
- Reading a high D as high diversity. In Simpson’s original form D is the chance of a same-species pair, so the birch wood’s 0.6449 means less diversity than the mixed wood’s 0.2073.
- Mixing up the two Ds. OCR’s D is 1 − Σ(n/N)², a diversity, while Simpson’s D is the other way up. A D of 0.2 describes a diverse habitat in Simpson’s form and a habitat dominated by one species in OCR’s.
- Using n² where the formula says n(n − 1). For the mixed wood Σn² is 558 and Σn(n − 1) is 508, so the two cannot be swapped.
- Stopping a step early. D, 1 − D and 1/D are three different numbers. Give the one the question asks for, and say which it is.
- Counting species alone. Richness misses evenness: both woods above have five species, and their indices differ by more than a factor of two.
- Comparing unequal samples. Fifty individuals from one site and 500 from another do not make a fair comparison, because the larger sample is likely to find more of the rare species.
Common questions
How do you calculate Simpson’s diversity index?
Count the individuals of each species, n, and of all species together, N. Work out n(n − 1) for every species, add the results, and divide by N(N − 1): D = Σn(n − 1) ÷ N(N − 1). For five species of 10, 15, 12, 8 and 5 individuals, Σn(n − 1) = 508 and N(N − 1) = 50 × 49 = 2,450, so D = 0.2073, and Simpson’s index of diversity is 1 − D = 0.7927.
What is the difference between D, 1 − D and 1/D?
They are three scales for one measurement. D is the chance that two individuals picked at random belong to the same species, so it falls as diversity rises. 1 − D is the chance that they belong to different species, and the reciprocal 1/D is 1 for a single species and rises with diversity. AQA’s index of diversity, d = N(N − 1) ÷ Σn(n − 1), is the same number as 1/D. Say which one you are quoting: a D of 0.8 means low diversity, while a 1 − D of 0.8 means high.
Why do some courses use 1 − Σ(n/N)² for Simpson’s index?
It is the form for picking two individuals with replacement, the one Simpson gave for a whole population, and it needs only each species’ share of the total. OCR writes Simpson’s index of diversity as D = 1 − Σ(n/N)², so its D is high for a diverse habitat. It is never above 1 − D from the n(n − 1) formula, because 1 − D = (1 − Σ(n/N)²) × N ÷ (N − 1): for 50 trees split 10, 15, 12, 8 and 5 among five species, the two give 0.7768 and 0.7927.
What is a high Simpson’s index of diversity?
1 − D runs from 0, when every individual belongs to one species, up to 1, which it reaches only when no two individuals share a species. Values near 1 need many species in similar numbers. There is no fixed threshold for high, so compare habitats sampled the same way: 50 trees split 10, 15, 12, 8 and 5 among five species give 0.79, and the same five species split 40, 4, 3, 2 and 1 give 0.36.
How is the Shannon diversity index different from Simpson’s?
Shannon’s index, H′ = −Σ p ln p with p = n ÷ N, gives rare species more weight, while Simpson’s is dominated by the commonest. H′ is not capped at 1: it is 0 for a single species and ln S when all S species are equally common, so Pielou’s evenness, J′ = H′ ÷ ln S, puts it on a scale from 0 to 1. Fifty trees split 10, 15, 12, 8 and 5 among five species give H′ = 1.549 and J′ = 0.962. The two indices usually rank habitats the same way, but not always.
Can Simpson’s index be used with percentage cover?
Only in its Σ(n/N)² form. n(n − 1) counts pairs of whole individuals, so it means nothing for cover, but 1 − Σ(n/N)² and Shannon’s H′ depend only on each species’ share of the total, which cover provides. For three plants with 50, 30 and 20 percent cover, the shares are 0.5, 0.3 and 0.2, so 1 − Σ(n/N)² = 1 − (0.25 + 0.09 + 0.04) = 0.62.