Gel Electrophoresis Simulator
A gel electrophoresis simulation: run a DNA ladder and restriction digests, set agarose, voltage and time, and size any band from the standard curve.
Simulator
Choose the band to size with the arrow keys: left and right change lane, up and down move along it. Space plays and pauses.
A 1% agarose gel, 60 of 60 minutes into a run at 100 V, 5 V/cm, with the DNA running from the wells at the top towards the positive electrode at the bottom. Lane 1, 1 kb ladder, 0.5 to 10 kb: 10 bands, from 10,000 bp at 1.08 cm to 500 bp at 5.34 cm. Lane 2, λ DNA cut with HindIII: 8 bands, from 23,130 bp at 0.512 cm to 125 bp at 6.33 cm. Lane 3, λ DNA cut with EcoRI: 6 bands, from 21,226 bp at 0.555 cm to 3,530 bp at 2.36 cm. Lane 4, The example sequence cut with EcoRI and HindIII: 3 bands, from 1,200 bp at 4.14 cm to 800 bp at 4.75 cm. The band chosen for sizing is band 6 of lane 3, 3,530 bp, 2.36 cm from its well.
- Estimated size Read off the standard curve at d = 2.362 cm: log₁₀ L = 4.268 − 0.2927 × 2.362 = 3.576.
- 3,770 bp
- Error of the estimate (estimate − actual) ÷ actual. The bands lie on a curve, and a straight line through all of them is furthest from it near the ends of the ladder.
- +6.801 %
- From the two nearest ladder bands log₁₀ L read on a straight line between the 4,000 bp and 3,000 bp ladder bands either side, which follows the curve far more closely than one line through every band.
- 3,541 bp
- Error from the two bands (estimate − actual) ÷ actual, for the reading between the two ladder bands either side.
- +0.2988 %
- Actual size Band 6 of lane 3, λ DNA cut with EcoRI: the length both estimates are judged against.
- 3,530 bp
- Distance from the well d = μ₀Et ÷ (1 + L/L½) = 6.75 cm ÷ (1 + 3,530/1,900).
- 2.362 cm
- Standard curve log₁₀ L against the distance d in cm: the least-squares straight line through the 10 ladder bands on the gel, with R² = 0.9964.
- 4.268 − 0.2927 d
- Half-speed length, L½ L½ = 1.9 kb × (1% ÷ T) to the power 1.6, for T percent agarose. A fragment this long moves at half the speed of free DNA, and this gel separates sizes best from about 380 to 9,500 bp, a fifth to five times L½.
- 1,900 bp
- Ladder bands
- Standard curve, the straight line through them
- The curve this gel really follows
Citing this tool
Last updated . Add the date you accessed it as well, which a citation of a page that can change asks for. If a specific result matters, cite the permalink from the tool’s share row instead of this page: it reproduces the exact parameters.
The equation
Southern (1979); Helling, Goodman and Boyer (1974); Stellwagen, Gelfi and Righetti (1997)
How gel electrophoresis separates DNA, and how this simulation models it
Gel electrophoresis sorts DNA fragments by length. They are loaded into wells at one end of an
agarose gel, an electric field pulls their negatively charged backbones towards the positive
electrode, and the gel’s mesh of fibres holds long fragments back more than short ones, so when the
power goes off each band’s distance from its well tells you its length. This simulation places
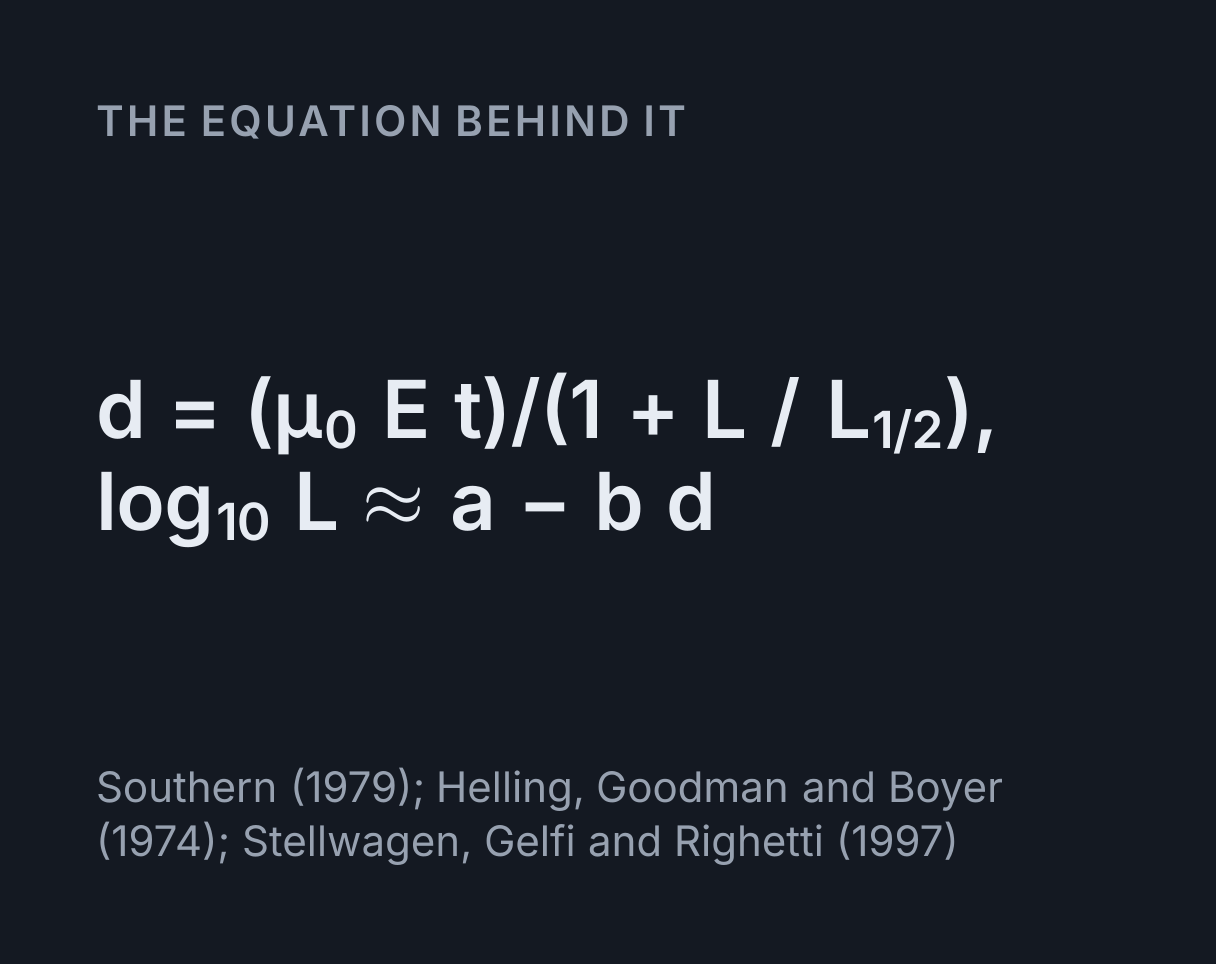
every band with d = μ₀Et ÷ (1 + L/L½), where L is the length in base pairs, and over
the range a gel separates well that gives the straight line every sizing exercise uses,
log₁₀ L ≈ a − b d.
The top of the fraction, μ₀Et, is how far DNA would travel with no gel in the way: the field E times the time t times the free-solution mobility, μ₀ = 3.75 × 10⁻⁴ cm²/(V s), which Stellwagen, Gelfi and Righetti measured in TAE buffer and found the same for every length from about 400 bp to 48.5 kb. The charge sits on the sugar-phosphate backbones that wind round the outside of the helix, as the DNA double helix explorer shows, one per base on each strand, so charge and drag grow together and free DNA cannot sort itself. The gel supplies the bottom of the fraction. L½ is the length that runs at half the free speed: a fragment far shorter slips through almost unhindered, and one far longer is slowed in proportion to its length. Written as 1/d rising in a straight line with L, it is the reciprocal relation Southern used in 1979 to fit real gels, with his limiting mobility set to zero.
Using the simulator
Lane 1 holds the ladder and lanes 2 to 4 hold samples: four λ DNA digests, φX174 DNA cut with HaeIII, or a sequence of your own cut with one or two restriction enzymes. Set the agarose percentage, the voltage and the run time, then press Play to watch the bands leave their wells. The scrubber steps through the run by hand, and changing a setting once the run has finished redraws the finished gel straight away. The ruler on the left measures from the bottom of the wells.
One band at a time is outlined for sizing, with a dashed line across to the ladder. Choose it with the lane and band fields, or select the gel and use the arrow keys: left and right change lane, up and down move along it. The readouts give its size read off the ladder’s standard curve, its size from the two ladder bands either side, the actual length both are judged against, and the error of each. The plot is the standard curve itself: log₁₀ of each ladder band’s size against its distance, the straight line fitted through those points and, dashed, the curve the gel really follows.
Worked example: sizing λ’s 3,530 bp EcoRI fragment
The simulator opens on a 1% gel run at 100 V for an hour, with the 1 kb ladder in lane 1 and λ DNA cut with EcoRI in lane 3. The band outlined is that digest’s shortest fragment, 3,530 bp.
- Field:
E = 100 V ÷ 20 cm = 5 V/cm. - Free DNA would travel
μ₀Et = 3.75 × 10⁻⁴ × 5 × 3600 = 6.75 cmin the hour. -
In 1% agarose
L½ = 1900 bp, so the fragment ends atd = 6.75 ÷ (1 + 3530/1900) = 2.362 cm. -
The ladder bands either side end at
6.75 ÷ (1 + 3000/1900) = 2.617 cmfor 3,000 bp and6.75 ÷ (1 + 4000/1900) = 2.174 cmfor 4,000 bp. -
The fragment sits
(2.617 − 2.362) ÷ (2.617 − 2.174) = 0.576of the way from one to the other, solog₁₀ L = log₁₀ 3000 + 0.576 × log₁₀(4000/3000) = 3.5491andL = 3541 bp, 0.3 percent long. -
A least-squares line through all ten ladder bands is
log₁₀ L = 4.268 − 0.2927 d, withR² = 0.9964. At 2.362 cm it giveslog₁₀ L = 3.5764, soL = 3770 bp, 6.8 percent long.
Those are the readouts at the opening settings. The two-band reading is more than twenty times closer than the line through every band, even though that line’s R² looks excellent, so use it wherever the unknown has ladder bands on both sides.
Reading the standard curve
The semi-log rule, distance falling in a straight line with log₁₀ of length, is usually credited to Helling, Goodman and Boyer’s 1974 study of EcoRI fragments, and it holds well only in the middle of a gel’s range. Long fragments crowd together near the wells, where the curve flattens, and short ones bunch towards the far end, where it flattens again. On the plot the ladder’s points bend away from the straight line at both ends, and a line forced through all of them is pulled off the curve in between.
R² does not warn you. In the worked example the line accounts for 99.64 percent of the spread in log₁₀ L and still reads the 3,530 bp fragment 6.8 percent long, because its misses are systematic rather than random. Elder and Southern compared the ways of turning mobility into length in 1983 and found every one more accurate used locally, on the ladder bands around the unknown, than globally. Even used locally, the semi-log line was the least accurate, wrong by up to almost 5 percent, against under 0.1 percent for Southern’s reciprocal relation. Read an unknown between its neighbours, as the two-band readout does, and treat any size from beyond the ladder’s last band as a rough guide.
The run time changes none of this. Every band’s distance is the same fraction of μ₀Et at every moment, so as the run goes on the curve stretches across the plot and its slope shrinks, but it reads the same size for the same band until a ladder band runs off. On a real gel a longer run does help, because it spreads the bands apart relative to their own width and to the precision of a ruler, which this model does not include. Separating compounds by how far they travel is the same idea a column uses, and the chromatography simulator reads retention times the way this reads distances.
Choosing the agarose percentage
Denser agarose has smaller pores, so L½ falls as the percentage rises: here
L½ = 1.9 kb × (1% ÷ T)^1.6 for T percent agarose. That law is a fit, not a derivation,
chosen to match the rough guide of best size ranges that many protocols print for standard agarose.
The steep stretch of the curve, where neighbouring sizes spread furthest apart, runs from about a
fifth of L½ to five times it, and the table sets that against the guide.
| Agarose | L½ in the model | Model, best range | Bench guide |
|---|---|---|---|
| 0.5% | 5.76 kb | 1.2 to 29 kb | 1 to 30 kb |
| 0.7% | 3.36 kb | 0.67 to 17 kb | 0.8 to 12 kb |
| 1.0% | 1.90 kb | 0.38 to 9.5 kb | 0.5 to 10 kb |
| 1.2% | 1.42 kb | 0.28 to 7.1 kb | 0.4 to 7 kb |
| 1.5% | 0.993 kb | 0.20 to 5.0 kb | 0.2 to 3 kb |
| 2.0% | 0.627 kb | 0.13 to 3.1 kb | n/a |
The trade shows directly. After an hour at 5 V/cm, 500 and 600 bp fragments end 0.21 cm apart in a 1% gel and 0.31 cm apart in a 2% one, while 8 and 10 kb fragments go the other way, from 0.22 cm apart to 0.092 cm. Pick the percentage whose range covers the fragments you need to tell apart, and a ladder that brackets them.
Voltage and run time
A band’s distance is proportional to the field times the time, so doubling the voltage halves the time for the same pattern: an hour at 100 V and half an hour at 200 V give the same gel here. The field is the voltage across the electrodes divided by the distance between them, 20 cm in this tank, which is why protocols quote volts per centimetre, and why the same 100 V runs faster in a smaller tank.
Run too long and the short fragments leave the gel. At 200 V for an hour, μ₀Et is 13.5 cm, and every fragment shorter than about 1.3 kb runs off the end of the 8 cm gel, the ladder’s 500 and 1,000 bp bands included; a small arrow at the foot of a lane marks bands that have gone. Addgene’s protocol runs a gel for 1 to 1.5 hours, until the loading dye is 75 to 80 percent of the way down, and Sambrook and Russell recommend 5 to 8 V/cm for the best resolution of DNA above 2 kb, because on a real gel long fragments lose resolution as the field rises.
What a digest puts in a lane
A restriction digest cuts every molecule at the same sites, so every fragment is present in equal numbers and a band’s share of the DNA, and of the stain, is in proportion to its length. λ DNA is 48,502 bp, and cut with HindIII it gives 23,130, 9,416, 6,557, 4,361, 2,322, 2,027, 564 and 125 bp. The longest band carries 47.69 percent of the DNA and the shortest 0.26 percent, which is why the 125 bp band is drawn faint and is often missed. The other digests are λ cut with EcoRI, with EcoRI and HindIII together, and with BstEII, and φX174’s 5,386 bp cut with HaeIII, a marker of 11 fragments from 72 to 1,353 bp for small DNA. Brightness says how much DNA a band holds only roughly; to compare how much of one sequence two samples started with, the qPCR and ΔΔCt simulator does it by counting cycles.
Two fragments closer than a band’s width merge into one. In the EcoRI lane, 5,804 and 5,643 bp end 0.036 cm apart after an hour in 1% agarose and draw as one thick band, and in the φX174 lane 281 and 271 bp, 0.027 cm apart, merge the same way. The HindIII marker has a trap of its own: its 23,130 and 4,361 bp fragments carry the two ends of λ, whose 12-base single-stranded ends can pair up again, so labs heat it before loading to part them. Thermo Fisher gives 65 °C for 5 minutes, then ice. The model always shows them apart.
Cutting your own sequence
Paste a sequence into the box and pick one or two enzymes, and any lane set to “The sequence below, cut” shows the fragments. Each enzyme cuts wherever its recognition site appears, at the point marked with a caret, EcoRI at G^AATTC for example. These sites are palindromes, the same read 5′ to 3′ on either strand, so a sequence and its reverse complement cut into the same pieces, and the reverse complement calculator turns one strand into the other if you need positions on the opposite strand. A line cut n times gives n + 1 fragments. A circle, such as a plasmid, gives n, since its ends were already joined, and an uncut circle gives no linear band at all.
The example in the box is 3,000 bases made up for this page, with one EcoRI site starting at base 1,000 and one HindIII site at base 2,200. Cut with both, it gives 1,000, 1,200 and 800 bp, which end 4.422, 4.137 and 4.75 cm from the well in the opening gel; read as a circle it gives 1,200 and 1,800 bp. After a double digest like this, the ligation calculator works out how much insert to add to the cut vector.
What this model leaves out
- A limiting speed for very long DNA. Beyond a few tens of kilobases, real DNA stops slowing with length and runs in one compressed band whose speed rises with the field, which is why pulsed-field gels are used for chromosomes. Here a long fragment keeps slowing, so λ’s 23,130 bp band sits nearer the well than on a real gel.
- Drag on short fragments. A real gel slows even fragments far shorter than L½ a little, so they finish somewhat nearer their wells than here.
- Band width. Every band is drawn the same thickness. Real bands spread by diffusion and broaden with the amount loaded and the time, which is what finally limits how close two bands can be and still be told apart.
- Circular DNA. A supercoiled plasmid is more compact than a nicked circle and usually runs ahead of it, and whether it runs ahead of or behind the same DNA cut open depends on the gel and the stain, so uncut circles are left off.
- The buffer, the stain and the heat. The model uses DNA’s mobility in TAE. In TBE, Stellwagen and colleagues measured 4.5 × 10⁻⁴ cm²/(V s), about 20 percent higher. Ethidium bromide bound to DNA slows it, and a gel run hard warms up and runs faster and less evenly.
- Sequence. Fragments of one length run at one speed here. Elder and Southern found sizes for λ restriction fragments in error by up to 3 percent, which they put down to base composition and sequence.
- The field’s effect on separation. Speed is simply proportional to the field here, so the voltage changes how far bands go but not how well they separate.
Common mistakes
- Measuring from the edge of the gel. Distances run from the bottom of the well, for the ladder and the unknown alike.
- Fitting one line through every ladder band. The ends of the ladder bend away from the line and drag it off the middle. In the worked example that turns 3,530 bp into 3,770.
- Trusting R². A line with R² = 0.9964 can still be almost 7 percent out.
- Sizing beyond the ladder. A band past the ladder’s last band is read off an extended line, where the curve bends most. Choose a ladder that brackets it, such as the 100 bp ladder for fragments under a kilobase.
- Plotting length on an ordinary axis. Plot log₁₀ of the length, or use semi-log paper. On a linear axis the ladder is a steep curve that nothing reads off cleanly.
- Loading at the wrong end. DNA runs to the positive electrode, usually red, so the wells go by the black, negative one.
- Reading a doublet as one fragment. A thick or bright band can be two fragments of nearly equal length, like λ EcoRI’s 5,804 and 5,643 bp.
Model and assumptions
- Method
- Exact expression, no time stepping
- Repeatability
- Deterministic. The same link gives the same numbers on any machine.
What it assumes
- Each fragment moves at one constant speed for the whole run, so its distance is d = μ₀Et ÷ (1 + L/L½): a reciprocal relation of the kind Southern (1979) fitted to gels, with his limiting mobility set to zero.
- μ₀ is the free-solution mobility of DNA in TAE buffer, 3.75 × 10⁻⁴ cm²/(V s), measured by Stellwagen, Gelfi and Righetti (1997), the speed a fragment far shorter than the gel’s pores approaches.
- L½, the length that runs at half that speed, is 1.9 kb in 1% agarose and falls as the percentage to the power 1.6, a fit to the size ranges bench guides give for 0.5 to 1.5% agarose rather than a law of physics.
- The field is the voltage over electrodes 20 cm apart, the gel runs 8 cm from the bottom of the wells, and a band that passes the end has run off and is not measured.
- The standard curve is a least-squares straight line of log₁₀ length on distance through every ladder band still on the gel, and the two-band estimate draws the same kind of line between the ladder bands either side of the unknown.
- Only linear DNA is run, so an uncut circle gives no band, and every fragment of one length runs at one speed whatever its sequence.
Where it stops holding. DNA longer than a few tens of kilobases, which on a real gel stops slowing with length and runs in one compressed band whose speed rises with the field, and runs at high voltage, where long fragments lose resolution and the gel heats up.
Numerical accuracy
No time stepping, so nothing accumulates: every band’s distance is a closed form in its length, the agarose, the field and the time, exact to rounding. The sizes read from the ladder are approximate by construction, and showing how far off they are is the point of the tool. The standard curve is a straight line standing in for a curve that bends, so a size read from it carries an error, shown beside the true length, and the reading between the two ladder bands either side of the band carries a much smaller one.
Common questions
How do you calculate DNA fragment size from a gel?
Measure how far each ladder band and the unknown band moved from the bottom of the well, plot log₁₀ of the ladder sizes against those distances, and read the unknown off the line, best off the stretch between the two ladder bands either side of it. In this simulator’s opening gel, λ’s 3,530 bp EcoRI fragment sits 2.362 cm from its well, between the 3,000 bp band at 2.617 cm and the 4,000 bp band at 2.174 cm, which gives 3,541 bp. One straight line through all ten ladder bands gives 3,770 bp instead.
What percentage agarose gel should I use?
Match the gel to the sizes you need to separate. The usual bench guide is 1 to 30 kb for 0.5% agarose, 0.5 to 10 kb for 1% and 0.2 to 3 kb for 1.5%, with 2% for the shortest fragments, up to about 2 kb. A denser gel has smaller pores, so it spreads short fragments further apart and crowds long ones near the wells. In this model a 1% gel separates best from about 380 bp to 9.5 kb, a fifth to five times its half-speed length of 1.9 kb.
Why do smaller DNA fragments move further in a gel?
Because the gel holds long ones back. Every nucleotide carries one negative charge on its phosphate, so charge and drag both grow with length, and in free solution DNA moves at one speed whatever its size: 3.75 × 10⁻⁴ cm²/(V s) in TAE buffer from about 400 bp to 48.5 kb, as Stellwagen, Gelfi and Righetti measured. The agarose mesh lets short fragments slip through almost freely, while long ones have to thread their way through it and are slowed roughly in proportion to their length.
Which way does DNA move in gel electrophoresis?
Towards the positive electrode, which is usually red, because DNA’s phosphate backbone is negatively charged at the pH of the running buffer. That is the source of the rule “run to red”: the wells go at the end nearest the black, negative electrode, so the DNA crosses the whole gel. A gel set in the tank the wrong way round sends the DNA out of the wells and into the buffer.
What are the band sizes of lambda DNA cut with HindIII?
23,130, 9,416, 6,557, 4,361, 2,322, 2,027, 564 and 125 bp, which add up to λ’s 48,502 bp. Each molecule gives one of each, so a band’s brightness follows its length: the 125 bp band holds 0.26 percent of the DNA and is often too faint to see. The 23,130 and 4,361 bp fragments carry λ’s 12-base cohesive ends and can stick together, so the marker is heated before loading; Thermo Fisher gives 65 °C for 5 minutes, then ice.
How does voltage affect gel electrophoresis?
Each band moves at a speed proportional to the field, so doubling the voltage halves the time for the same pattern. Across electrodes 20 cm apart, 100 V is 5 V/cm, and in this model an hour at 100 V gives the same gel as half an hour at 200 V, while an hour at 200 V runs every fragment shorter than about 1.3 kb off an 8 cm gel. On a real gel long fragments also lose resolution at high fields, which is why Sambrook and Russell recommend 5 to 8 V/cm for DNA above 2 kb.