HPLC and GC Chromatography Simulator
Chromatography simulator for HPLC and GC: change the solvent, oven temperature or column and watch peaks separate, with retention times and resolution.
Simulator
Use the arrow keys to change the acetonitrile percentage. Space plays and pauses.
Chromatogram from HPLC with 50% acetonitrile on a 150 mm column of 5 µm particles: A at 5.305 min, B at 10.41 min, C at 10.78 min, D at 18.27 min. The closest pair, B and C, has a resolution of 1.07, short of the 1.5 needed for baseline resolution. The run has not started, and every band is at the inlet.
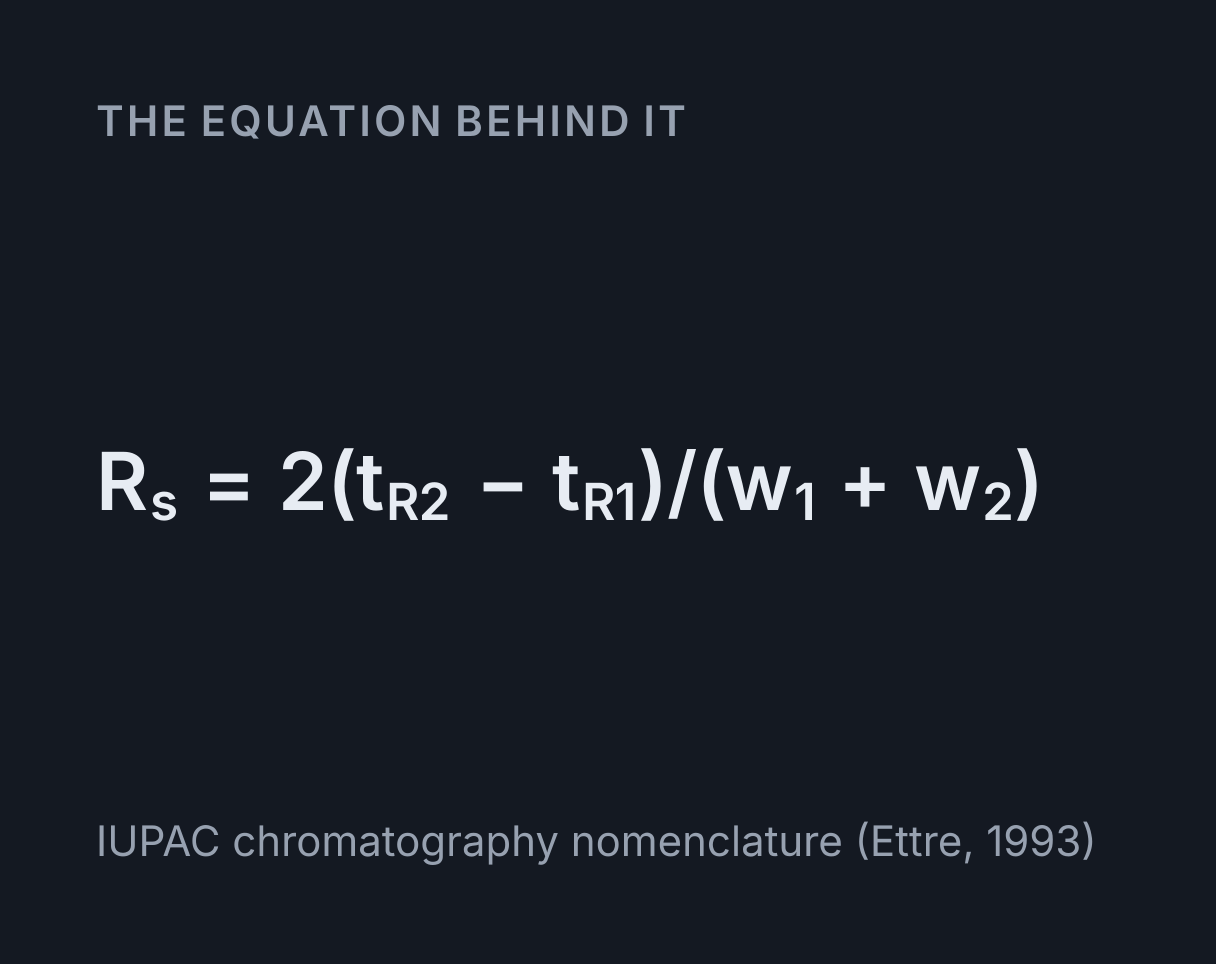
- Resolution Rs Rs = 2(tR2 − tR1)/(w1 + w2) for B and C, the closest neighbours, which are partly resolved. Rs = 1.5 or more is baseline resolution.
- 1.07
- Critical pair The two neighbouring peaks with the lowest resolution. The separation stands or falls on them, since every other pair is further apart.
- B and C
- Selectivity α α = k2/k1 = 3.311/3.162, the later peak’s retention factor over the earlier’s. At α = 1 a pair co-elutes however many plates the column has.
- 1.047
- Plate count N N = L/H = 150 mm ÷ 10.13 µm. Every peak’s base width is 4tR/√N, with √N = 121.7.
- 14,810
- Plate height H van Deemter: H = A + B/u + Cu = 5 + 2 + 3.125 µm at u = 1 mm/s, a reduced velocity u dp/Dm of 5.
- 10.13 µm
- Optimum velocity u = √(B/C), the bottom of the van Deemter curve, where H falls to A + 2√(BC) = 10 µm.
- 0.8 mm/s
- Dead time tM tM = L/u = 150 mm ÷ 1 mm/s, the time an unretained molecule takes to cross the column. Each peak elutes at tR = tM(1 + k).
- 2.5 min
- Run time When the last peak, D, reaches the detector: tR = tM(1 + k) = 2.5 × (1 + 6.31) min.
- 18.27 min
| Peak | tR, min | k | Base width, min | Rs to next |
|---|---|---|---|---|
| A | 5.305 | 1.122 | 0.1743 | 19.76 |
| B | 10.41 | 3.162 | 0.342 | 1.07 |
| C | 10.78 | 3.311 | 0.3542 | 15.7 |
| D | 18.27 | 6.31 | 0.6005 | n/a |
- Resolution of the critical pair
- Baseline resolution, Rs = 1.5
- Plate height H
- B/u, diffusion along the column
- Cu, mass transfer
- A, eddy diffusion
Citing this tool
Last updated . Add the date you accessed it as well, which a citation of a page that can change asks for. If a specific result matters, cite the permalink from the tool’s share row instead of this page: it reproduces the exact parameters.
The equation
IUPAC chromatography nomenclature (Ettre, 1993)
What does a chromatography simulator calculate?
A chromatography simulator predicts the chromatogram a column will give: when each compound
in a mixture reaches the detector, how wide its peak is, and whether neighbouring peaks are
separated. Each analyte leaves the column at its retention time, tR = tM(1 + k),
where tM is the dead time and k is the analyte’s retention factor. Two neighbours are judged
by their resolution, Rs = 2(tR2 − tR1)/(w1 + w2), the gap between them over
their average width at the base. At Rs = 1.5 or more the trace returns to the baseline
between them, called baseline resolution.
In reversed-phase HPLC the percentage of acetonitrile in the mobile phase sets every retention factor, and in gas chromatography the oven temperature does. In both, the column’s length and its particle size or internal diameter set its plate number through the van Deemter equation, and the plate number sets every peak’s width. Chromatography separates by partition between two phases; the gel electrophoresis simulator separates by size in an electric field instead, and a compound collected from a column is often identified by its NMR splitting pattern.
Retention time and the retention factor
A molecule spends part of its time held by the stationary phase and part carried along by the
mobile phase. The retention factor k is time held over time moving, so its band travels at
u/(1 + k) and leaves a column of length L at tR = (L/u)(1 + k). Rearranged,
k = (tR − tM)/tM, which is how k is read from a chromatogram: the time past the
dead time, in units of it.
A small k elutes close to the dead time, where peaks crowd together among anything
unretained, and a large one wastes time on low, broad peaks. Isocratic methods usually
aim for k between about 1 and 10. For reversed-phase HPLC the linear solvent strength model of
Snyder, Dolan and Gant (1979) gives log k = log kw − Sφ, where φ is the volume
fraction of acetonitrile, kw the retention factor extrapolated to pure water and S a constant
for each compound, about 4 for a small molecule. With S = 4, ten points less acetonitrile
multiplies k by 10^0.4 = 2.51, close to the common rule of thumb that k roughly
triples.
Using the simulator
Choose HPLC or GC and how many analytes to inject. For HPLC the sliders set the acetonitrile, the column length, the particle size and the velocity; for GC, the oven temperature, the column length, its internal diameter and the helium velocity. Play runs one injection: the bands leave the inlet together, pull apart and spread as they travel, and draw their peaks at the detector, each shaded in its analyte’s colour under the summed trace. The scrubber steps through the run, and with the scene selected the arrow keys change the acetonitrile or the oven temperature.
The readouts give the critical pair, the two neighbouring peaks closest together, with its resolution and selectivity α = k2/k1, and the column’s plate count, plate height, best velocity, dead time and run time. The first plot is a window diagram, the critical pair’s resolution across the whole range of acetonitrile or oven temperature with a dashed line at Rs = 1.5; the second is the column’s van Deemter curve, with a dot at the set velocity.
A real HPLC detector is usually a UV absorbance cell, so a peak’s area turns into a concentration through the Beer-Lambert law, against standards made up with a dilution calculator. Here every analyte is injected in the same amount, so every peak has the same area and later, broader peaks are lower.
Worked example: four analytes at 50 percent acetonitrile
The simulator opens on a 150 mm HPLC column packed with 5 µm particles, run at 1.0 mm/s with 50 percent acetonitrile. The diffusion coefficient of a small molecule in the mobile phase is taken as 1 × 10⁻⁹ m²/s.
- Dead time:
tM = L/u = 150 mm ÷ 1.0 mm/s = 150 s = 2.50 min. - Reduced velocity:
ν = u dp/Dm = 1.0 × 10⁻³ × 5 × 10⁻⁶ ÷ 10⁻⁹ = 5. -
The van Deemter terms:
A = 1 × 5 µm = 5 µm,B/u = 2Dm/u = 2 µmandCu = 0.125 × 5 µm × 5 = 3.125 µm, soH = 5 + 2 + 3.125 = 10.125 µm. -
Plate count:
N = L/H = 150 mm ÷ 0.010125 mm = 14,815, which the readout rounds to 14,810, and √N = 121.72. -
The close pair:
kB = 10^(2.5 − 4.0 × 0.5) = 3.16228andkC = 10^(2.72 − 4.4 × 0.5) = 3.31131. -
Their retention times:
tR = 2.5 × 4.16228 = 10.406 minfor B and2.5 × 4.31131 = 10.778 minfor C, which the table rounds to 10.41 and 10.78. They are2.5 × 0.14903 = 0.3726 minapart. -
Base widths, w = 4tR/√N:
4 × 10.406 ÷ 121.72 = 0.3420 minfor B and4 × 10.778 ÷ 121.72 = 0.3542 minfor C. - Resolution:
Rs = 2 × 0.3726 ÷ (0.3420 + 0.3542) = 1.070.
So B and C are partly resolved: a clear valley, but no return to the baseline. Their
selectivity is α = 3.31131 ÷ 3.16228 = 1.047, which is 10^0.02.
A elutes at 5.305 min and D at 18.27 min, each far clear of its neighbour, so the whole
separation stands or falls on B and C.
Resolution in chromatography
Resolution weighs the gap between two peaks against their widths. The base width of a Gaussian peak, between the tangents through its inflection points, is four standard deviations, so at Rs = 1.5 two equal peaks have their apexes six standard deviations apart, and only about 0.13 percent of each peak’s area lies past the midpoint between them. At Rs = 1.0 that share is about 2.3 percent, and the trace dips only 73 percent of the way to the baseline between the apexes. At 0.5 or less two equal peaks merge into a single lump with no dip at all, so a badly overlapped pair can pass for one compound.
Purnell’s equation shows what Rs depends on:
Rs = (√N/4) × ((α − 1)/α) × (k2/(1 + k2)), a product of efficiency, selectivity
and retention. For the opening pair it gives 30.43 × 0.04501 × 0.7681 = 1.052,
against 1.070 from the widths, because it gives both peaks the width of the later one.
Selectivity is the strongest lever, since α − 1 is a small number that can easily double.
Efficiency enters only as a square root. Retention helps only while k is small: k2/(1 + k2) is
0.5 at k = 1 but already 0.91 at k = 10.
Three ways to resolve a close pair
- Selectivity. Drop the acetonitrile from 50 to 48 percent. B and C have different S values, so their retention factors rise at different rates: α grows from 1.047 to 1.067 and Rs from 1.07 to 1.563, while D takes 22.54 min to come out instead of 18.27. Go the other way and the pair closes until, at 55 percent, B and C co-elute, and above that C comes out first.
- Efficiency, by length. A 300 mm column has twice the plates, 29,630, but resolution grows only as √N, to 1.514, and the run doubles to 36.55 min.
- Efficiency, by particle size. Pack the 150 mm column with 2 µm particles and run it at 2.0 mm/s: the plate height falls to 4 µm, N rises to 37,500 and Rs to 1.703, and the run halves to 9.137 min. The catch is back pressure, which scales as u/dp², so this column needs 12.5 times the pressure of the opening one, which is why sub-2 µm particles need UHPLC pumps.
On the window diagram, the closest pair is baseline resolved at 48 percent acetonitrile or less, at a growing cost in time. Between the two crossings, at 55 and 75 percent, the order changes to A, C, B, D, and the closest pair never reaches 1.5: the best is about 1.34, near 70 percent, in a run under 4 minutes.
The van Deemter equation
The van Deemter equation, published by van Deemter, Zuiderweg and Klinkenberg in 1956, gives
the plate height H, the length of column per theoretical plate, against the mobile-phase
velocity: H = A + B/u + Cu. Each term is a different way a band spreads.
- A, eddy diffusion. Paths of different lengths through the packing, in proportion to the particle size and whatever the velocity.
- B/u, longitudinal diffusion. A band diffuses along the column for as long as it is inside, so this term dominates at low velocity. B goes as Dm.
- Cu, resistance to mass transfer. Molecules take time to move in and out of the stationary phase, so the faster the flow, the further the moving ones get ahead. C goes as dp²/Dm.
The curve has a minimum at u = √(B/C), where H = A + 2√(BC). The
packed column here uses the reduced coefficients 1, 2 and 0.125, which put the smallest plate
height at twice the particle size, the usual benchmark for a well-packed column, at a reduced
velocity of 4. For the opening column that is 0.8 mm/s and 10 µm. The opening velocity,
1.0 mm/s, costs only 1.25 percent in plate height, and slowing to the optimum raises Rs only
from 1.070 to 1.077 while making the run 25 percent longer.
Smaller particles lower the whole curve and move its minimum to faster flow, since the optimum velocity goes as 1/dp: for 1.7 µm particles it is 2.353 mm/s, with H = 3.4 µm. Their C term is also far flatter, going as dp², so small-particle columns can be run fast with little loss. Running too slowly is the opposite mistake: at 0.2 mm/s the opening column’s plate height is 15.63 µm, more than half as large again as at the optimum, because longitudinal diffusion takes over.
Gas chromatography: temperature in place of solvent
In gas chromatography the mobile phase is an inert gas that hardly interacts with the
analytes, so the oven temperature sets retention. The retention factor follows the van ’t Hoff
equation, ln k = ln k100 + (ΔH/R)(1/T − 1/T100), where ΔH is the enthalpy of
moving the analyte out of the stationary phase into the gas and k100 is its retention factor
at 100 °C. Retention falls exponentially as the oven warms: near 100 °C, B’s retention factor
halves for every 21 °C, the same exponential dependence on 1/T that the
Arrhenius equation gives a reaction rate.
A capillary GC column is an open tube with the stationary phase as a film on its wall, so it
has no packing and no A term. Golay’s equation for an open tube gives H = B/u + Cu,
with B = 2Dm and C set by the square of the internal diameter, and for a well-retained
analyte its smallest plate height is 0.957 times the internal diameter. At the GC opening settings, a 30 m × 0.25 mm column with
helium at 25 cm/s and the oven at 100 °C:
tM = 30 m ÷ 0.25 m/s = 120 s = 2.00 min.-
H = B/u + Cu = 0.1200 + 0.1194 = 0.2394 mm, at the bottom of the curve, since the optimum is 25.07 cm/s. N = 30 m ÷ 0.2394 mm = 125,300, over eight times the HPLC column’s plates.- B and C, with k = 3.00 and 3.05, come out at 8.00 and 8.10 min with Rs = 1.099.
With so many plates, a selectivity of only 1.017 nearly separates them. Cooling the oven to 94 °C raises the resolution to 1.522, with D out at 21.11 min rather than 17.00. Warming it closes the gap until B and C co-elute at about 120 °C, and above that they swap order. A 0.53 mm megabore column has far fewer plates, and the pair falls to 0.6639.
What this model leaves out
- Gradients and temperature programmes. Most real methods raise the acetonitrile or the oven temperature during the run, bringing late peaks out sooner and sharper; here both are constant.
- A plate height for each peak. Every peak shares its column’s plate height. In reality the C term depends on k, most of all in an open tube, where Golay’s factor runs from 1/96 for an unretained solute to 11/96 for a well-retained one, and the model takes the second.
- Pressure and gas compression. Back pressure is never computed, though it limits how long, fine-grained and fast an HPLC column can be. In GC the gas expands along the column, so its velocity rises towards the outlet; the velocity here is an average.
- Injection, tubing and peak shape. Injection is instantaneous, nothing outside the column adds broadening, and every peak is a Gaussian. Real peaks tail when a few strong sites hold an analyte, and distort when too much is injected.
- Fixed diffusion. Diffusion coefficients change with temperature, solvent and pressure; here they are fixed, and the HPLC column’s temperature plays no part.
Common mistakes
- Using half-height widths in the base-width formula. Rs = 2(tR2 − tR1)/(w1 + w2) needs widths at the base. With widths at half height it becomes Rs = 1.18(tR2 − tR1)/(w½,1 + w½,2); using them in the base-width formula overstates Rs by a factor of 1.70.
- Expecting twice the column to double the resolution. Doubling L doubles N, and Rs grows only as √N: 1.070 becomes 1.514, not 2.14, and the run takes twice as long.
- Working out k from the injection. k = (tR − tM)/tM, so peak B, out at 10.406 min with tM = 2.50 min, has k = 3.162, not 10.406 ÷ 2.5 = 4.162.
- Mixing up the plate count formulas. From a peak, N = 16(tR/w)² with the base width, or N = 5.545(tR/w½)² with the width at half height. From peak B, 16 × (10.406 ÷ 0.3420)² = 14,813, the same as L/H to within the rounding of the width.
Model and assumptions
- Method
- Exact expression, no time stepping
- Repeatability
- Deterministic. The same link gives the same numbers on any machine.
What it assumes
- Retention follows the linear solvent strength model in HPLC, log k = log kw − Sφ with φ the acetonitrile fraction, and the van ’t Hoff equation in isothermal GC, so each retention factor depends only on the solvent or the oven temperature.
- Each analyte elutes at tR = tM(1 + k), with the dead time tM = L/u, as a Gaussian peak whose standard deviation is tR/√N, and resolution is Rs = 2(tR2 − tR1)/(w1 + w2) with base widths of four standard deviations.
- The plate height comes from the van Deemter equation with reduced coefficients 1, 2 and 0.125 for a packed HPLC column, and from Golay’s open tube equation, with no A term and its mass-transfer factor taken at large k, for a GC column.
- Every peak has its column’s plate height whatever its retention factor, so the plate number is a property of the column alone.
- Diffusion coefficients are fixed at 1 × 10⁻⁹ m²/s in the liquid and 1.5 × 10⁻⁵ m²/s in the helium, and the carrier gas velocity is held at its set value at any oven temperature.
- The analytes A to D are illustrative small molecules injected in equal amounts, with no gradient, temperature programme, extra-column broadening, peak tailing or overload.
Where it stops holding. Gradient elution and temperature programmes, where retention changes during the run, and tailing or overloaded peaks, which are not Gaussian. Early GC peaks are also narrower than shown, since their mass-transfer term is smaller than the large-k value used.
Numerical accuracy
No method error to report: the result is a closed-form expression evaluated directly, with no time stepping to accumulate error. What remains is double-precision rounding, of order one part in 10^16 per operation.
Common questions
What is a good resolution value in chromatography?
Rs = 1.5 or more is baseline resolution: the apexes of two equal peaks are then six standard deviations apart, and only about 0.13 percent of each peak’s area lies past the midpoint between them. At Rs = 1.0 that share is about 2.3 percent and a valley remains between the peaks, and at 0.5 or less two equal peaks merge into one. Methods that must stay robust often aim for 2 or more, to leave a margin as the column ages.
How do you calculate resolution from a chromatogram?
Measure each peak’s retention time and its width at the base, between the tangents through its inflection points, and use Rs = 2(tR2 − tR1)/(w1 + w2). With widths at half height the equation becomes Rs = 1.18(tR2 − tR1)/(w½,1 + w½,2). In the simulator’s opening run, B and C are 0.3726 min apart with base widths of 0.3420 and 0.3542 min, so Rs = 2 × 0.3726 ÷ 0.6962 = 1.070.
What does the van Deemter equation describe?
It gives the plate height H, the length of column per theoretical plate, against the mobile-phase velocity u: H = A + B/u + Cu. A is eddy diffusion through the packing, B/u is diffusion along the column, which dominates at low velocity, and Cu is the lag in mass transfer between the phases, which dominates at high velocity. The plate height is lowest at u = √(B/C); for the opening column of 5 µm particles that is 0.8 mm/s, where H = 10 µm.
How do you calculate the number of theoretical plates?
From a peak, N = 16(tR/w)² with the base width, or N = 5.545(tR/w½)² with the width at half height. From the column, N = L/H. The opening column has H = 10.125 µm, so N = 150 mm ÷ 10.125 µm = 14,815, and peak B, at 10.406 min with a base width of 0.3420 min, gives 16 × (10.406 ÷ 0.3420)² = 14,813, the same to within the rounding of the width.
Why does less acetonitrile increase retention in reversed-phase HPLC?
The stationary phase is non-polar and the mobile phase polar, so water is the weak solvent: the less acetonitrile there is, the poorer a solvent the mobile phase is for a non-polar analyte, and the longer the analyte stays in the stationary phase. The linear solvent strength model writes this as log k = log kw − Sφ. With S = 4, ten points less acetonitrile multiplies k by 2.51, and at the simulator’s opening settings going from 50 to 48 percent takes the close pair from Rs = 1.070 to 1.563.
How does oven temperature affect retention in gas chromatography?
A hotter oven drives analytes out of the stationary phase into the carrier gas, so the retention factor falls exponentially, following the van ’t Hoff equation. In the simulator’s mixture, B’s retention factor halves for every 21 °C near 100 °C. Temperature changes selectivity too: cooling from 100 to 94 °C takes B and C from Rs = 1.099 to 1.522, and above about 120 °C they swap order.