Photoelectron Spectroscopy Visualiser
Draw the photoelectron spectroscopy (PES) spectrum of any atom from H to Kr, with a peak per subshell sized by its electrons, and compare two elements.
Visualiser
With the spectrum focused, the left and right arrow keys step to the previous and next element, and Home and End go to hydrogen and krypton.
Photoelectron spectrum of argon on a logarithmic axis of binding energy, which falls from left to right, with peak heights giving the number of electrons. Argon has 5 peaks: 1s, 2 electrons at 309.4 MJ/mol; 2s, 2 electrons at 31.5 MJ/mol; 2p, 6 electrons at 24.04 MJ/mol; 3s, 2 electrons at 2.821 MJ/mol; 3p, 6 electrons at 1.526 MJ/mol.
- Element Atomic number 18: 18 protons in the nucleus, and as many electrons in the neutral atom.
- Argon (Ar)
- Configuration from the peaks Each peak is one subshell and its height is the number of electrons in it, so reading the peaks from left to right writes out the configuration.
- 1s² 2s² 2p⁶ 3s² 3p⁶
- Electrons per shell Peaks from the same shell sit together, n = 1 at the far left, apart from the 3d from scandium to bromine, which sits well to the right of the 3s and 3p. The heights of each shell’s peaks, shown by their colour, add up to these.
- 2, 8, 8
- Peaks One for each occupied subshell. Their heights add up to 18, the atomic number, as they must for a neutral atom.
- 5
- 1s binding energy The 1s electrons are the closest to the nucleus and the hardest to remove: 3206.3 eV each, which is 309.4 MJ/mol at 0.096485 MJ/mol per eV.
- 309.4 MJ/mol
- First ionisation energy The lowest binding energy in the spectrum, 15.76 eV, is the energy that frees the outermost electron: the first ionisation energy. The 3p peak is drawn at 15.82 eV, the average of its two components, 15.94 and 15.76 eV.
- 1.521 MJ/mol
- 1s binding energy
| Peak | Electrons | Binding energy, eV | MJ/mol |
|---|---|---|---|
| 1s | 2 | 3206.3 | 309.4 |
| 2s | 2 | 326.5 | 31.5 |
| 2p | 6 | 249.2 from 250.6 and 248.5 | 24.04 |
| 3s | 2 | 29.24 | 2.821 |
| 3p | 6 | 15.82 from 15.94 and 15.76 | 1.526 |
Free-atom binding energies from Carlson, Photoelectron and Auger Spectroscopy (1975), Table A1.A, after Lotz (1970), each to the figures the table gives. Where the table splits a p or d subshell into two spin-orbit levels, the peak is their average weighted by the electrons each holds, 2 and 4 for p and 4 and 6 for d. The colour of a peak is its shell: n = 1, 2, 3 and 4.
Citing this tool
Last updated . Add the date you accessed it as well, which a citation of a page that can change asks for. If a specific result matters, cite the permalink from the tool’s share row instead of this page: it reproduces the exact parameters.
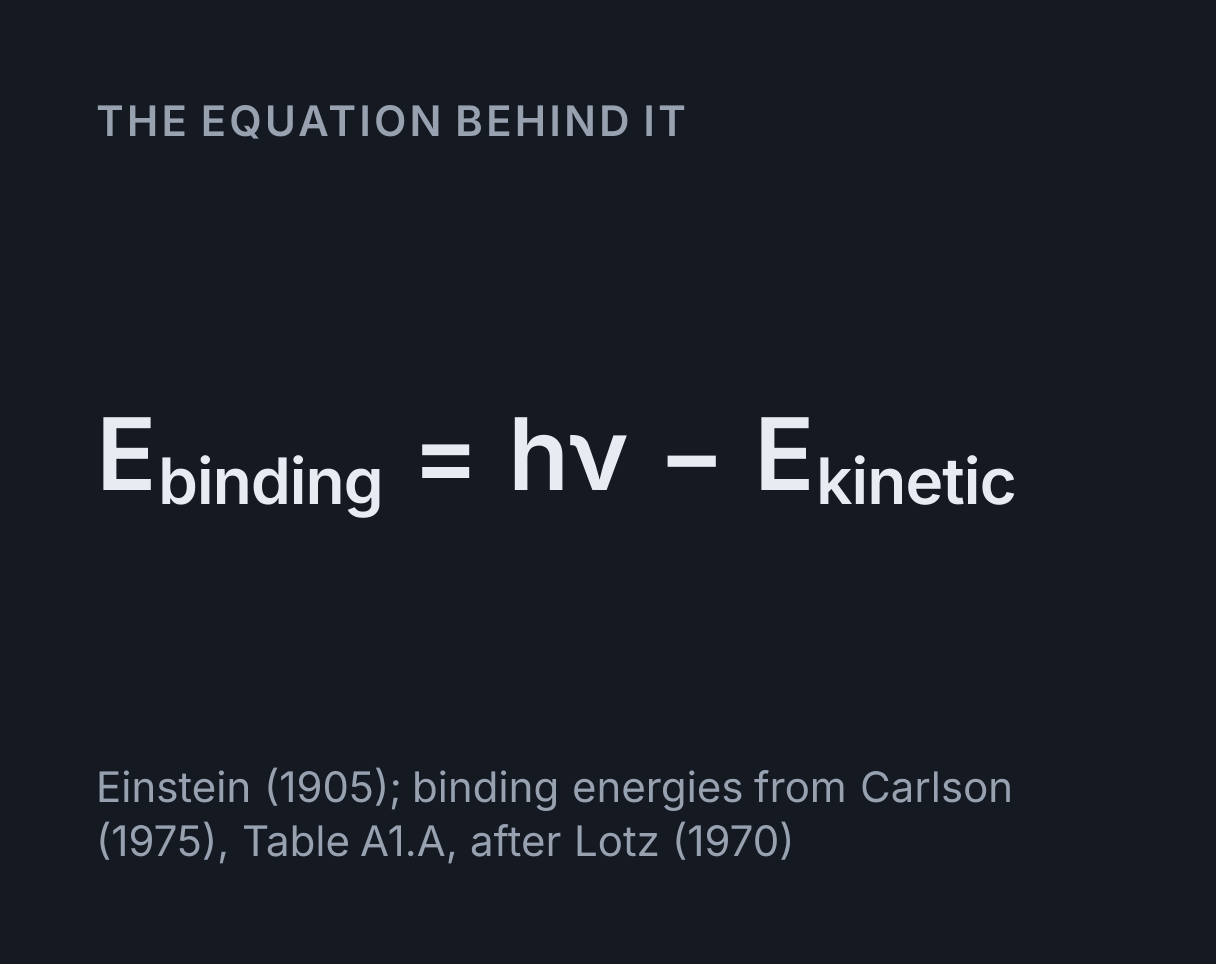
The equation
Einstein (1905); binding energies from Carlson (1975), Table A1.A, after Lotz (1970)
What is photoelectron spectroscopy?
Photoelectron spectroscopy, or PES, measures how tightly an atom holds each of its electrons. Light of
one known energy shines through a gas of atoms and knocks electrons out of them, and the spectrometer
measures the kinetic energy each electron leaves with. What the electron needed in order to escape is
its binding energy, the photon’s energy less the kinetic energy left over:
E_binding = hν − E_kinetic.
Every electron in one subshell needs the same energy to escape, so the electrons come out at a handful of energies, one for each occupied subshell. Plot the number of electrons against binding energy and the result is a photoelectron spectrum: one peak per subshell, with the height of each peak set by how many electrons the subshell holds. A full s subshell gives a peak of height 2, a full p subshell a peak of height 6 and a full d subshell a peak of height 10.
The light has to carry more energy than the electron needs. Ultraviolet light from a helium lamp, at
21.22 eV, frees only outer electrons, while X-rays reach inner subshells as well. An aluminium Kα source
gives 1486.6 eV, so an argon 2p electron, which needs 249.2 eV, leaves with
1486.6 − 249.2 = 1237.4 eV of kinetic energy, though argon’s 1s electrons, at 3206.3 eV,
need harder X-rays still. It is the same energy balance as the
photoelectric effect, which the Photoelectric Effect Simulator
shows for electrons leaving a metal surface.
How to read a PES spectrum
Start at the left, because by convention the axis runs backwards: binding energy rises from right to left. The leftmost peak is always the 1s, the innermost electrons, and the rightmost is the outermost electron, so its binding energy is the atom’s first ionisation energy.
- Position is the binding energy. Peaks far to the left are core electrons close to the nucleus, and the peaks at the right are the valence electrons.
- Height is the number of electrons in the subshell, relative to the other peaks, and the heights add up to the atomic number.
- Grouping shows the shells. The peaks of one shell sit together, with a wide gap before the next shell, and within a shell the s peak lies to the left of the p peak and the p to the left of the d. The 3d is the exception: from scandium to bromine it sits well to the right of the 3s and 3p, and from scandium to zinc it lies right beside the 4s.
Reading the peaks from left to right, each with its height as a superscript, writes out the electron
configuration, which you can check against the
Electron Configuration Calculator. Energies come
in two units. Physicists quote electronvolts per electron, and AP Chemistry quotes megajoules per mole of
atoms. One electronvolt per atom is 96.485 kJ/mol = 0.096485 MJ/mol.
Using the visualiser
Choose any element from hydrogen to krypton and the spectrum redraws, with each peak labelled with its subshell and binding energy and coloured by its shell. Choose a second element under Compare with and its spectrum appears below the first, on the same energy axis and the same electron scale, so you can see how far every peak moves. The Energy axis control switches between a logarithmic axis, a broken axis made of linear pieces and a plain linear one, and Energy unit switches between MJ/mol and eV.
The readouts give the configuration read from the peaks, the electrons in each shell, the number of peaks, the 1s binding energy and the first ionisation energy, and with a comparison, how far the 1s peak moved. The table under the plot lists every peak in both units. Values keep the precision the source table gives them: where the table prints 9 eV, the visualiser shows 0.9 MJ/mol rather than a string of invented digits. The plot follows one subshell, the 1s to start with, across every element that has it. With the spectrum focused, the left and right arrow keys step through the elements.
Worked example: the spectrum of argon
The visualiser opens on argon, Z = 18, on a logarithmic axis in MJ/mol. Its spectrum takes a few steps to read, and each one can be checked against the readouts.
- Count the peaks. There are five, so argon’s electrons sit in five subshells.
- Add the heights. From the left they are 2, 2, 6, 2 and 6, and
2 + 2 + 6 + 2 + 6 = 18, the atomic number. - Read the configuration. From left to right the peaks are 1s, 2s, 2p, 3s and 3p, so
argon is
1s² 2s² 2p⁶ 3s² 3p⁶, with 2, 8 and 8 electrons in its three shells. - Convert the 1s peak. The table gives 3206.3 eV, and
3206.3 × 0.096485 = 309.4 MJ/mol, which is the 1s binding energy readout. - Combine a split level. The table lists argon’s 2p as two levels: 250.6 eV for the two
electrons with j = ½ and 248.5 eV for the four with j = 3/2. One peak stands for both, at their weighted
mean,
(2 × 250.6 + 4 × 248.5) / 6 = 249.2 eV, which is24.04 MJ/mol. - Find the first ionisation energy. The rightmost peak is the 3p, drawn at 15.82 eV from
its two levels at 15.94 and 15.76 eV. The lower one frees the most loosely held electron, so it is
argon’s first ionisation energy:
15.76 × 0.096485 = 1.521 MJ/mol. - Compare core and valence.
3206.3 / 15.82 = 202.7, so a 1s electron is held about 200 times as tightly as a 3p electron.
The 3s peak sits at 29.24 eV, nearly twice the 15.82 eV of the 3p, although both belong to the third shell. That gap between s and p in one shell is the evidence for subshells. The Bohr model, which the Bohr Model Simulator draws, gives each shell a single energy and has no way to split it. The same numbers show what a helium lamp can and cannot do: at 21.22 eV it frees argon’s 3p electrons but not its 3s.
Why binding energies rise with nuclear charge
An electron is held by the pull of the nucleus, and every extra proton pulls harder. Inner electrons feel almost the full nuclear charge, because few electrons lie between them and the nucleus, so their binding energies climb steeply with atomic number. The 1s binding energy is 13.60 eV in hydrogen, 870.1 eV in neon, 3206.3 eV in argon and 14,327 eV in krypton.
For a single electron around a nucleus of charge Z, the 1s binding energy is 13.6 × Z² eV,
which gives hydrogen its 13.60 eV. Argon’s nucleus would hold a lone electron with
13.6 × 18² = 4406 eV, and argon’s real 1s electrons need 3206.3 eV, about three quarters as
much, because the other seventeen electrons shield part of the nuclear charge. Shielding matters far more
further out: argon’s 3p electrons, outside ten inner electrons, need only 15.82 eV.
Compare argon with potassium to see both effects at once. Potassium has one more proton, so every inner peak moves to the left: the 1s goes from 3206.3 to 3610 eV, a change the readout gives as +404 eV, or +39 MJ/mol. Potassium’s nineteenth electron starts a new shell, so a new peak appears far to the right, the 4s at 4.341 eV, or 0.4188 MJ/mol, with a height of 1. Across a period the rightmost peak moves left as the nuclear charge grows, and the first ionisation energy rises, though not at every step, from 5.139 eV in sodium to 15.76 eV in argon, then drops back at the start of the next shell. The trend plot shows the same for whichever subshell it follows. The 1s rises at every step from hydrogen to krypton, while the 2p dips at oxygen, to 13.62 eV from 14.53 eV in nitrogen, where the fourth 2p electron has to share an orbital.
Subshells, and the 4s and 3d puzzle
Within one shell, s electrons are bound more tightly than p electrons, and p more tightly than d, because an s electron spends more of its time close to the nucleus, inside the inner electrons’ shielding. The Atomic Orbitals Visualiser shows why: an s orbital has density right at the nucleus, and p and d orbitals have none there.
The transition metals hold a classic puzzle. The 4s subshell fills before the 3d, yet in their spectra
the 3d peak sits to the left of the 4s. Iron’s 3d electrons need 9 eV and its 4s electrons 7.870 eV, so
the 4s peak is the rightmost, and the 4s electrons are the first to go when iron forms an ion: Fe²⁺ is
[Ar] 3d⁶, not [Ar] 3d⁴ 4s². The peak heights also show the two exceptions to
the filling rule below krypton. Chromium has a 3d peak of height 5 and a 4s peak of height 1, for
[Ar] 3d⁵ 4s¹, and copper has 10 and 1, for [Ar] 3d¹⁰ 4s¹.
Molecules have photoelectron spectra too, with one band for each occupied molecular orbital rather than each atomic subshell, which is how the energy order in a molecular orbital diagram was confirmed by measurement.
Logarithmic, broken and linear axes
The energies in one spectrum cover a huge range. Krypton’s 1s electrons need about a thousand times the energy of its 4p electrons, 14,327 eV against 14.22 eV, so on a linear axis, which keeps the true spacing, the 1s sits at the far left and every other peak piles up in the last few pixels near zero. Switch to the linear axis to see it: the visualiser can only name the pile with one bracket.
A logarithmic axis gives every factor of ten the same width, so 1 to 10, 10 to 100 and 100 to 1000 MJ/mol each take a third of argon’s axis, and close peaks stay apart. A broken axis keeps the energies linear but cuts out the empty stretches between groups of peaks, marking each cut with a pair of slashes, which is how AP exam spectra are often drawn. This one breaks wherever two neighbouring peaks are more than 2.5 times apart in energy, which keeps each shell’s s and p peaks together and separates the shells, though from scandium to germanium the 3d shares a piece with the 4s.
Where the numbers come from
Every binding energy comes from one table, T. A. Carlson’s Table A1.A, Binding Energies of Electrons in Free Atom, in Photoelectron and Auger Spectroscopy (1975). For hydrogen to krypton it reproduces W. Lotz’s free-atom table of 1970, except krypton, which Carlson updated to the gas-phase measurements of Kai Siegbahn’s group. The values are for free atoms, measured from the vacuum level, and each atom’s outermost value is its first ionisation energy. One table for every element keeps them on the same footing, so a step between two neighbours is a difference between the atoms rather than between two kinds of measurement.
Lotz built the inner levels from X-ray measurements on the elements in their usual forms, and for the solids he added each solid’s work function, typically 2 to 5 eV, to bring them to the vacuum level. That works well for the gases and less well for the shallow inner levels of the metals, which come out a few electronvolts below later measurements on metal vapours: the table gives sodium’s 2p electrons 34 eV, where sodium vapour shows about 38 eV. One entry looks like a misprint, manganese’s 2s at 755 eV, which sits below the trend of its neighbours and even below the 769.1 eV measured for the solid. It is shown as printed.
What this model leaves out
- Peak widths. Real peaks have widths, set by how long the hole left behind lasts and by the spectrometer’s resolution. Every peak here is drawn equally narrow.
- Spin-orbit splitting. A p or d level splits in two, as argon’s 2p does into 250.6 and 248.5 eV in a ratio of 1 to 2, and a good X-ray spectrometer resolves the pair. Each pair is drawn here as one peak at the weighted mean.
- Multiplets and satellites. Removing an electron from an atom with a part-filled subshell can leave the ion in several states, so nitrogen or oxygen shows more than one line where this shows one, and a second electron is sometimes lifted to a higher level at the same moment, adding small extra peaks.
- Real intensities. The heights here are electron counts. A measured peak’s size also depends on how readily light of that energy ionises that subshell, which changes with the photon energy, so a real 2p peak is rarely exactly three times a 2s peak.
- Atoms in molecules and solids. Bonding shifts core binding energies by a few electronvolts, which is what makes X-ray photoelectron spectroscopy useful for analysing surfaces, and a solid’s energies are measured from its Fermi level, lower than the vacuum level by the work function.
- Relaxation. A binding energy is the energy difference between the atom and the ion it leaves behind, so it includes the other electrons rearranging around the hole, which makes it a little smaller than the orbital energy a calculation with the other electrons held still would give.
Common mistakes
- Reading the axis the wrong way. Binding energy increases to the left, so the peak at the far right is the easiest electron to remove, not the hardest.
- Mistaking height for energy. A tall peak means many electrons, not tightly held ones. Argon’s 3p peak is three times as tall as its 1s peak and needs about a two-hundredth of the energy.
- Counting a p peak as three electrons. A full p subshell holds six electrons, so its peak is three times as tall as a full s peak in the same spectrum.
- Putting 4s to the left of 3d. In the transition metals the 4s peak is to the right: 4s fills first, but its electrons are held less tightly and leave first.
- Treating the peaks as successive ionisation energies. Each peak takes one electron from a neutral atom, each time from a different subshell. Argon’s 3s peak at 29.24 eV is not its second ionisation energy, 27.63 eV, which takes a second 3p electron from an Ar⁺ ion.
- Mixing the units. To turn electronvolts per electron into MJ/mol, multiply by 0.096485, and to go back, divide by it.
Common questions
What does photoelectron spectroscopy measure?
It measures the binding energy of the electrons in each subshell of an atom or molecule. Light of one known energy, hν, knocks electrons out, the spectrometer measures their kinetic energy, and the binding energy is hν minus that kinetic energy. Each occupied subshell gives one peak, as tall as the subshell has electrons, so argon’s spectrum has five peaks, for 1s, 2s, 2p, 3s and 3p, with heights 2, 2, 6, 2 and 6.
How do you read a PES spectrum?
Start at the left, where the binding energy is highest: the leftmost peak is 1s, and the peaks of each shell sit together, s before p before d. Each peak’s height is the number of electrons in that subshell, so peaks of heights 2, 2, 6, 2 and 1 read as 1s² 2s² 2p⁶ 3s² 3p¹, which is aluminium. The rightmost peak is the outermost electron, and its binding energy is the first ionisation energy, 5.986 eV for aluminium.
Why do binding energies increase with atomic number?
Each extra proton pulls harder on every electron, and inner electrons feel almost all of that charge, so their peaks move to higher binding energy, further to the left. The 1s binding energy climbs from 13.60 eV in hydrogen to 870.1 eV in neon, 3206.3 eV in argon and 14,327 eV in krypton. Going from argon to potassium adds one proton and moves the 1s peak from 3206.3 to 3610 eV, while potassium’s new 4s electron, alone in a new shell, needs only 4.341 eV.
Why is the 4s peak to the right of the 3d peak?
In the transition metals the 4s electrons are held less tightly than the 3d electrons, even though 4s fills first. Iron’s 3d electrons need 9 eV and its 4s electrons 7.870 eV, so the 4s peak is the rightmost, and the 4s electrons are the first to go when iron forms an ion: Fe²⁺ is [Ar] 3d⁶, not [Ar] 3d⁴ 4s².
Why do my AP Chemistry PES values differ from these?
They come from a different compilation. This visualiser uses one free-atom table for every element, T. A. Carlson’s Table A1.A of 1975, which follows W. Lotz (1970), and shows each value only to the figures that table gives. For most peaks the two agree within a few percent: argon’s 1s is 309.4 MJ/mol here and 309 MJ/mol in a common AP data set. The biggest gaps are the inner levels of the metals, which Lotz built from measurements on solids. A common AP data set gives sodium’s 2p electrons 3.67 MJ/mol, which is 38.0 eV and close to what sodium vapour shows, where the table here gives 34 eV, or 3.3 MJ/mol.
What is the difference between PES and successive ionisation energies?
PES takes one electron from each of many neutral atoms, from whichever subshell the light reaches, so every peak is a first ionisation from a different subshell. Successive ionisation energies take electrons from the same atom one after another, each from an ion more positive than the last. Argon’s 3s peak at 29.24 eV is the energy to remove a 3s electron from a neutral atom, while argon’s second ionisation energy, 27.63 eV, removes a second 3p electron from an Ar⁺ ion.