Error Bars and Worst-Fit Line Calculator
Enter readings with error bars to draw the best fit and worst fit lines, and get the gradient and intercept with uncertainties and percentage uncertainty.
Calculator
- Error bars
- Steepest line
- Shallowest line
- Best fit
- Readings
- Gradient The least-squares gradient m, with half the spread of the worst-fit gradients, (maximum − minimum) ÷ 2, as its uncertainty Δm.
- 2.0 ± 0.2 V/mA
- Percentage uncertainty The uncertainty in the gradient as a percentage of the gradient: Δm ÷ |m| × 100.
- 10.68 %
- y-intercept Where the best-fit line crosses x = 0, with half the difference between the worst-fit lines’ intercepts as its uncertainty.
- 0.1 ± 0.7 V
- Maximum gradient The steepest line that still passes through every error bar. The working names the two corners it rests on.
- 2.2 V/mA
- Minimum gradient The shallowest line that still passes through every error bar. The working names the two corners it rests on.
- 1.775 V/mA
- Single worst line For courses that draw one worst acceptable line and quote its difference from the best gradient: the larger of the two gaps between m and the maximum or minimum gradient.
- 0.215 V/mA
- Through the origin A line through (0, 0) can pass through every error bar, with a gradient from 1.96 to 2.075 V/mA, so the readings are consistent with y ∝ x.
- Possible
Readings
One reading per row: x is Current (mA) and y is Voltage (V). A ± box holds half the length of that error bar, such as a meter’s resolution or half the range of repeat readings, and an empty one means no bar. Paste columns from a spreadsheet into a box to fill several rows at once.
| Point | x | y | ±y | Remove |
|---|---|---|---|---|
| 1 | ||||
| 2 | ||||
| 3 | ||||
| 4 | ||||
| 5 |
Working
- n = 5
- mean x = 15 / 5 = 3 mA
- mean y = 30.5 / 5 = 6.1 V
- Sxx = Σ(x - mean x)^2 = 10
- Sxy = Σ(x - mean x)(y - mean y) = 19.9
- best gradient m = Sxy / Sxx = 19.9 / 10 = 1.99 V/mA
- best intercept c = mean y - m × mean x = 6.1 - 1.99 × 3 = 0.13 V
- The steepest line passes through the bottom of point 1’s error bar at (1, 1.7) and the top of point 4’s error bar at (4, 8.3).
- maximum gradient = (8.3 - 1.7) / (4 - 1) = 2.2 V/mA
- its intercept = 1.7 - 2.2 × 1 = -0.5 V
- The shallowest line passes through the top of point 1’s error bar at (1, 2.7) and the bottom of point 5’s error bar at (5, 9.8).
- minimum gradient = (9.8 - 2.7) / (5 - 1) = 1.775 V/mA
- its intercept = 2.7 - 1.775 × 1 = 0.925 V
- uncertainty in gradient = (2.2 - 1.775) / 2 = 0.2125 V/mA
- percentage uncertainty = 0.2125 / 1.99 × 100 = 10.678 %
- uncertainty in intercept = |0.925 - (-0.5)| / 2 = 0.7125 V
- gradient = 2.0 ± 0.2 V/mA
- y-intercept = 0.1 ± 0.7 V
- With one worst line instead, the steepest line differs from m by 0.21 and the shallowest line by 0.215.
- A line through the origin can pass through every error bar, with a gradient from 1.96 to 2.075 V/mA, so the readings are consistent with y being proportional to x.
Every pair of error-bar corners is tried, so each worst-fit line pivots on whichever bars limit it rather than always on the first and last.
Citing this tool
Last updated . Add the date you accessed it as well, which a citation of a page that can change asks for. If a specific result matters, cite the permalink from the tool’s share row instead of this page: it reproduces the exact parameters.
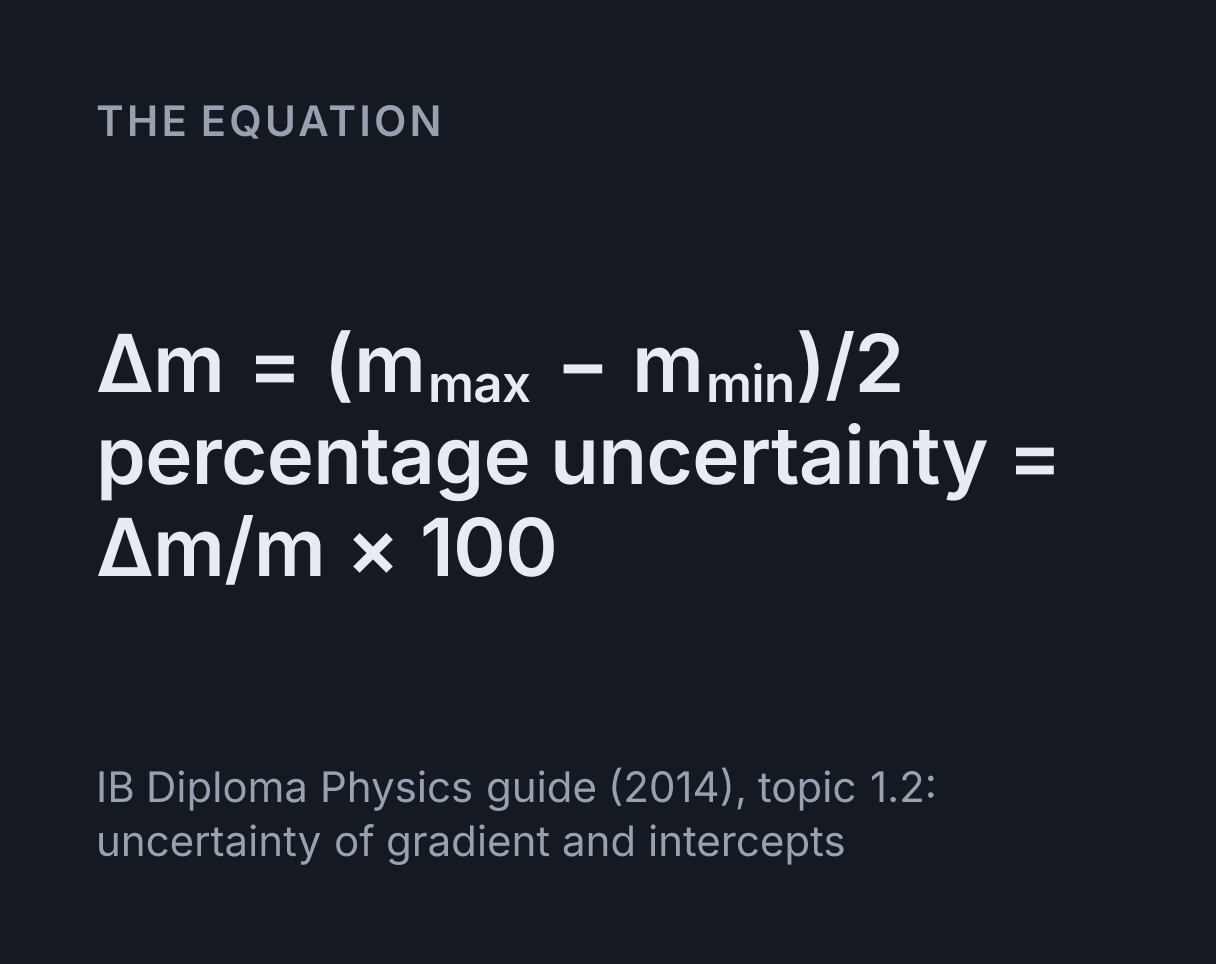
The equation
IB Diploma Physics guide (2014), topic 1.2: uncertainty of gradient and intercepts
What is a worst-fit line?
A worst-fit line is the steepest or the shallowest straight line that still passes through every
error bar on a graph. The two of them bracket every gradient the measurements allow, and the
uncertainty in the gradient is half the difference between them:
Δm = (m_max − m_min) ÷ 2. Dividing by the best gradient gives the percentage
uncertainty, Δm ÷ m × 100.
The same two lines give the uncertainty in the y-intercept, as half the difference between the points where they cross the y-axis. Both matter in a write-up, because a gradient or an intercept usually stands for something, such as a resistance, a spring constant or a stopping voltage, and a value without its uncertainty cannot be compared with anything.
Using the calculator
Type each reading into the table: x, y and ±y, which is half the length of the y error bar. Switch on error bars on x for a ±x column as well. A block of columns copied from a spreadsheet can be pasted into any box, and Enter moves down a row. Name the axes with the unit in brackets, as in Voltage (V), and the gradient and intercept are given in those units.
The graph shows the readings, their error bars, the least-squares line of best fit and the two worst-fit lines. The readouts give the gradient and the intercept with their uncertainties, rounded so that the uncertainty keeps one significant figure, or two when it starts with a 1, and the value stops at the same decimal place. Below them are the percentage uncertainty, the maximum and minimum gradients, and whether a line through the origin fits. The working names the two corners of the error bars that each worst-fit line rests on, so the same lines can be drawn on paper.
With error bars on both axes, each point’s two bars outline a box, and a line counts as passing through them when it crosses that box. The calculator tries the line through every pair of box corners, which finds the true steepest and shallowest lines even when they do not run between the end bars.
Choosing the size of each error bar
An error bar shows the uncertainty in one plotted value. For a single reading it usually comes
from the instrument: half the smallest division on an analogue scale, or one unit in the last
digit of a digital meter. For repeated readings, half the range is the usual choice:
repeats of 4.0, 4.3 and 4.2 V have a mean of 4.17 V and an uncertainty of
(4.3 − 4.0) ÷ 2 = 0.15 V.
When the plotted quantity is calculated, its error bar follows from the reading’s. Squaring
doubles the percentage uncertainty, so a period of 2.00 ± 0.02 s, which is 1 percent, gives
T² = 4.00 ± 0.08 s², which is 2 percent.
Worked example: a resistor’s voltage against current
The calculator opens on five readings of the voltage across a resistor at currents from 1 to 5 mA, each voltage read to ±0.5 V.
- Best fit. The means are 3 mA and 6.1 V, and least squares gives
m = Sxy ÷ Sxx = 19.9 ÷ 10 = 1.99V/mA andc = 6.1 − 1.99 × 3 = 0.13V. - The obvious steepest line fails. From the bottom of the first bar, (1, 1.7),
to the top of the last, (5, 10.8), the gradient is
9.1 ÷ 4 = 2.275, but at 4 mA that line is at1.7 + 2.275 × 3 = 8.525V, above the top of point 4’s bar at 8.3 V. - The steepest line pivots on point 4 instead:
(8.3 − 1.7) ÷ (4 − 1) = 2.2V/mA, crossing the y-axis at1.7 − 2.2 × 1 = −0.5V. - The shallowest line runs from the top of the first bar to the bottom of the
last:
(9.8 − 2.7) ÷ (5 − 1) = 1.775V/mA, with intercept2.7 − 1.775 × 1 = 0.925V. - The uncertainties.
Δm = (2.2 − 1.775) ÷ 2 = 0.2125V/mA, which is0.2125 ÷ 1.99 × 100 = 10.7percent, andΔc = (0.925 − (−0.5)) ÷ 2 = 0.7125V. - The result. The gradient is
2.0 ± 0.2V/mA, a resistance of 2.0 ± 0.2 kΩ since a volt per milliamp is a kilohm, and the intercept is0.1 ± 0.7V.
The intercept’s range, −0.6 V to 0.8 V, includes zero, and lines through the origin with gradients from 1.96 to 2.075 V/mA pass through every bar, so the readings are consistent with the voltage being proportional to the current, as Ohm’s law expects.
Half the spread, or one worst line?
Two conventions are in use. Half the spread, which the calculator leads with, treats the steepest and shallowest lines alike and is the version usually taught for IB Physics, whose syllabus asks for the uncertainty in gradients and intercepts. Some A level practical handbooks instead use one worst acceptable line, either the steepest or the shallowest, and quote the difference between its gradient and the best one. For the example that gives 0.21 V/mA with the steepest line and 0.215 V/mA with the shallowest, and the Single worst line readout shows the larger. All three round to 0.2 V/mA here, but they need not agree, so use the one your course asks for.
None of them is the standard error a statistics package reports. Pasted into the linear regression calculator, the same five points give a standard error in the slope of 0.068 V/mA, about a third of the worst-fit figure. The standard error comes from how far the points scatter about the line, while the worst-fit lines come from the error bars, so they still give an uncertainty when the points happen to lie on a perfect line.
What this model leaves out
- Weighting. The best-fit line is unweighted least squares, so a point with a short error bar has no more say than one with a long bar. A weighted fit, with each point weighted by 1/Δy², is the usual next step at university.
- Curves. Only straight lines are tried. A curved relationship has to be plotted in a form that should be straight first, such as T² against L for a pendulum, with the uncertainties worked out for those values.
- Systematic error. A zero error shifts every reading by the same amount, which moves the intercept, and a miscalibrated scale stretches them all, which changes the gradient. Neither shows in the error bars or the worst-fit lines.
- Anomalies. No reading is left out automatically. When no straight line passes through every error bar, the calculator names the reading to check, if a single one is to blame, and leaves the decision to you.
- Confidence. The worst-fit range is not a confidence interval. It shows what the error bars allow, and it is only as honest as the uncertainties typed in.
- How repeats are spread. An error bar uses only the ends of a range. With many repeats of one reading, a histogram of them, which the frequency density and histogram calculator draws, shows whether half the range is a fair uncertainty.
Common mistakes
- Assuming the worst-fit lines join the end bars. They often do, but a reading off the trend can block them, as point 4 does here. Check each line against every bar.
- Reading the intercept off the edge of the grid. Where the line meets the left
edge is the y-intercept only if that edge is x = 0. Otherwise work it out as
c = y − mxfrom a point on the line. - Taking the gradient from two readings. A gradient is read from two points on the line, far apart. For a worst-fit line, the corners of the bars it rests on are those points.
- Quoting too many figures. 1.99 ± 0.2125 claims digits the uncertainty rules out. Round the uncertainty to one significant figure, or two if it starts with a 1, and the value to the same decimal place, which the significant figures calculator can help with.
- Calling it a percentage error. The percentage uncertainty is the spread the error bars allow. A percentage error compares a result with an accepted value, and the percent error calculator works that out.
- Losing the sign. On a falling graph the steepest line has the most negative gradient, which is the minimum. The uncertainty is still half the spread and is quoted as a positive number.
Common questions
How do you draw a worst-fit line?
Plot the error bars and the line of best fit first. Then draw the steepest straight line that still passes through every error bar, and the shallowest one. Each usually runs between opposite ends of the first and last bars, but a reading that sits off the trend can block that line, so check every bar and pivot on any it misses. In this calculator’s example the line from the bottom of the first bar to the top of the last has a gradient of 2.275 but passes above point 4’s bar, so the steepest line pivots on point 4 instead, with a gradient of 2.2.
How do you calculate the uncertainty in a gradient?
Take half the difference between the gradients of the steepest and shallowest lines through the error bars: (maximum gradient − minimum gradient) ÷ 2. For gradients of 2.2 and 1.775 V/mA that is 0.2125 V/mA, about 11% of the best gradient of 1.99 V/mA, so the result is quoted as 2.0 ± 0.2 V/mA. Some A level courses draw a single worst line instead and take the difference between its gradient and the best one, which here gives 0.21 V/mA for the steepest line or 0.215 V/mA for the shallowest.
How do you find the uncertainty in the y-intercept?
Use the same two worst-fit lines. Find where each crosses the y-axis and take half the difference. In the example the steepest line crosses at −0.5 V and the shallowest at 0.925 V, so the uncertainty is 0.7125 V and the intercept is quoted as 0.1 ± 0.7 V. If the x-axis does not start at zero, work each intercept out as c = y − mx from a point on that line rather than reading it off the edge of the grid.
What if no straight line passes through all the error bars?
Then a reading or its uncertainty is wrong, or the relationship is not a straight line. A single anomalous reading is the usual cause, and the calculator names the one whose removal would let a line through every other bar, when there is exactly one. Error bars that are too short come next, for instance from quoting a meter’s resolution when repeat readings varied by more than that. If the points follow a curve, plot a form that should be straight, such as T² against L for a pendulum, before fitting.
Is the worst-fit uncertainty the same as the standard error of the slope?
No. The standard error from least squares measures how far the points scatter about the best line, while the worst-fit lines show how far the line could move and still pass through the error bars. For the example readings the standard error of the slope is 0.068 V/mA and the worst-fit uncertainty is 0.21 V/mA, about three times as large. The worst-fit method still gives an uncertainty when the points happen to lie exactly on a line, where the standard error would be zero.
How do error bars show that y is proportional to x?
Proportionality needs a straight line through the origin, so check whether one can pass through every error bar. If one can, the readings are consistent with y ∝ x; if none can, they rule it out, however close the intercept looks to zero. The calculator’s Through the origin readout makes this check. For the example readings, lines through the origin with gradients from 1.96 to 2.075 V/mA pass through every bar, so the voltage is consistent with being proportional to the current, as Ohm’s law expects for a resistor.