Margin of Error Calculator
Find the margin of error for a proportion or a mean at 90, 95 or 99% confidence, with z* or t*, the confidence interval and each step shown.
Calculator
Successes divided by n, as a decimal: 0.52 for 52 percent. At 0.5 the margin is at its widest, the figure a poll quotes.
How many were sampled, as a whole number.
- Margin of error ±3.099 percentage points around p̂.
- ±0.03099
- Critical value z* The z for 95% confidence: 2.5% of the curve lies above it and 2.5% below its negative, leaving 95% in the middle.
- 1.9600
- Standard error √(p̂(1 − p̂)/n), how far p̂ typically lands from the true proportion from one sample to the next.
- 0.01581
- 95% confidence interval p̂ ± E. The method captures the true proportion in this share of samples; any one interval either contains it or does not.
- 0.46901 to 0.53099
- In percentage points The margin as a poll reports it: a margin of 0.031 is ±3.1 percentage points.
- ±3.099
- Successes and failures n p̂ and n(1 − p̂). The normal approximation behind the margin needs at least 10 of each, the Large Counts condition.
- 500 and 500
Working, with your numbers
- E = z* × √(p̂(1 − p̂) / n), with z* = 1.9600 at 95%
- = 1.9600 × √(0.5 × 0.5 / 1000)
- = 1.9600 × 0.015811
- = 0.03099, or ±3.099 percentage points
z* is used to full precision, so the last figure can differ from working with z* rounded to three decimals.
Citing this tool
Last updated . Add the date you accessed it as well, which a citation of a page that can change asks for. If a specific result matters, cite the permalink from the tool’s share row instead of this page: it reproduces the exact parameters.
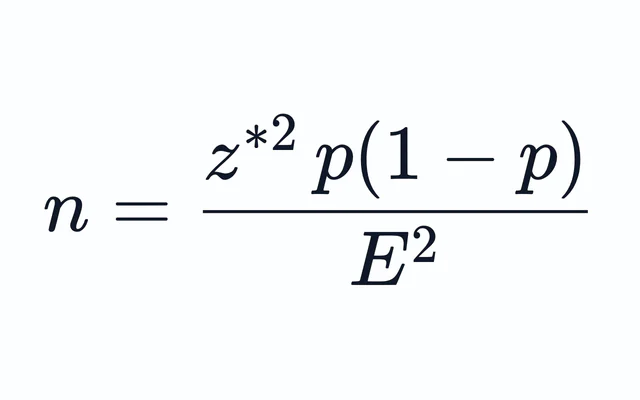
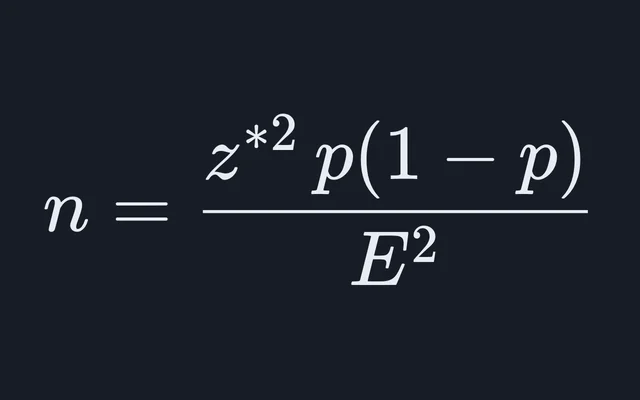
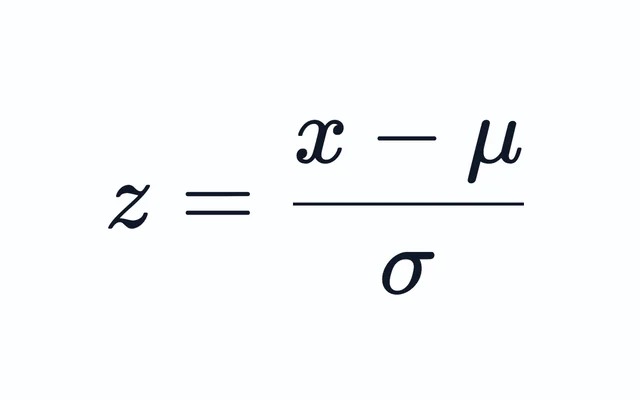
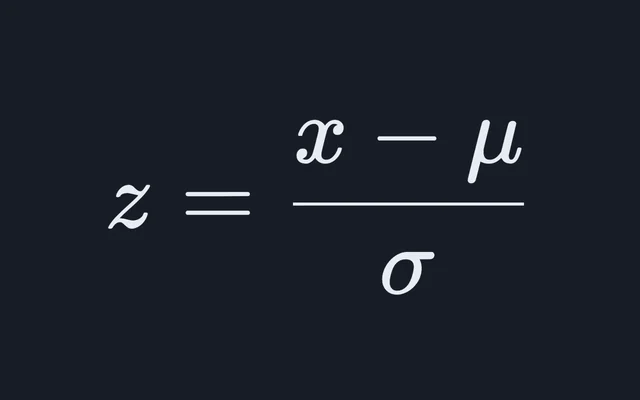
The equation
Neyman (1937), confidence intervals; Student (1908), the t distribution
How do you calculate the margin of error?
Multiply a critical value by the standard error of the estimate. For a sample proportion, E = z* × √(p̂(1 − p̂) / n). For a sample mean, E = z* × σ / √n when the population standard deviation σ is known, or E = t* × s / √n on n − 1 degrees of freedom when s comes from the sample. The confidence interval is the estimate ± E.
z* or t*: choosing the critical value
The critical value sets how many standard errors the interval reaches on each side of the estimate. It comes from the standard normal curve, as z*, for a proportion and for a mean whose σ was known before sampling. It comes from Student’s t distribution, as t*, for a mean whose spread is the sample’s own standard deviation s. Because s is itself uncertain, the interval widens to allow for it, and the allowance shrinks as the sample grows, so t* falls toward z*.
| Confidence | z* | t*, n = 5 | t*, n = 10 | t*, n = 30 |
|---|---|---|---|---|
| 90% | 1.645 | 2.132 | 1.833 | 1.699 |
| 95% | 1.960 | 2.776 | 2.262 | 2.045 |
| 99% | 2.576 | 4.604 | 3.250 | 2.756 |
The calculator carries z* at full precision, 1.959964 at 95 percent rather than 1.960, so its last figure can differ from a textbook answer worked with the rounded value. Its t* is the printed t table up to 30 degrees of freedom and is computed beyond that. At 95 percent it is the same t* the standard deviation calculator uses for its confidence interval.
What makes the margin wider or narrower
- Sample size. The margin falls with the square root of n, so four times the sample halves it. A poll of 1,000 has a margin of ±3.1 percentage points at 95 percent, and 4,000 respondents bring it only to ±1.5.
- Confidence level. At 99 percent the margin is 31 percent wider than at 95 percent, the ratio of the two z* values. At 90 percent it is narrower, and the interval misses the true value more often.
- The proportion itself. p̂(1 − p̂) peaks at 0.25 when p̂ is 0.5, so a near-even split has the widest margin. At p̂ = 0.1 or 0.9 the product is 0.09, and the margin is 60 percent of that maximum.
- Spread, for a mean. The margin is proportional to σ or s. Halving the variability of the measurements halves the margin, the same gain as quadrupling the sample.
Conditions to check before trusting a margin
The formulas assume the data behave like a simple random sample. These are the checks the AP Statistics course makes before a one-sample confidence interval:
- Random. The data come from a random sample or a randomized experiment. A margin computed for a self-selected online poll has no meaning, because the formula measures the variation that chance selection causes.
- 10 percent condition. When sampling without replacement, n is at most 10 percent of the population, so the observations are close enough to independent.
- Large Counts, for a proportion. At least 10 successes and 10 failures, so n p̂ ≥ 10 and n(1 − p̂) ≥ 10, which keeps the sampling distribution of p̂ close to normal. The calculator warns below that.
- Normal or large sample, for a mean. The population is roughly normal, or n is at least 30. Below 30, a dotplot or boxplot of the data should show no strong skew or outliers.
Margin of error for a mean, with t*
A random sample of 16 bags from a filling line has a mean weight of 28.4 g and a sample standard deviation of 1.2 g. The standard deviation comes from the same bags, so the margin uses t* on 15 degrees of freedom, which is 2.131 at 95 percent:
- E = t* × s / √n, with t* = 2.131 on 15 degrees of freedom at 95%
- = 2.131 × 1.2 / √16
- = 2.131 × 0.3
- = 0.6393
With z* in place of t*, the margin would be 0.588 g, narrower than the sample supports.
The 95 percent confidence interval for the line’s mean fill is 27.76 g to 29.04 g. With only 16 bags, it also relies on the fill weights being roughly normal, which is why the calculator adds a caution below n = 30.
What the margin of error leaves out
The margin counts one source of error: the chance variation between one random sample and the next. Nonresponse, a sampling frame that misses part of the population, leading question wording and untruthful answers all bias an estimate, and none of them shrinks as n grows. A survey with a ±3 point margin can miss by far more for those reasons.
The confidence level describes the method, not one interval. At 95 percent, intervals built this way capture the true value in 95 percent of random samples. A particular interval, once computed, either contains the true value or does not.
Common mistakes
- Typing a percentage as a whole number. p̂ and E are decimals: 52 percent is 0.52, and a margin of 3 points is 0.03. The calculator refuses a proportion above 1 rather than return a meaningless margin.
- Using z* with a small sample’s s. At n = 10 and 95 percent, t* is 2.262, so the correct margin is 15 percent wider than the one z* gives.
- Applying one share’s margin to a lead. In a two-way race, a voter who switches moves the gap between the candidates by two, so the margin on the gap is nearly double the margin on either share, and exactly double when every respondent picks one of the two. A 52 to 48 result with a ±3 point margin is not a clear lead.
- Quoting the whole poll’s margin for a subgroup. A subgroup of 200 inside a poll of 1,000 has its own margin, ±6.9 points at 95 percent rather than ±3.1.
Worked examples
Each one runs through the calculator above, so the arithmetic here is the arithmetic it does.
What is the margin of error for 52% support in a poll of 600 at 95% confidence?
- E = z* × √(p̂(1 − p̂) / n), with z* = 1.9600 at 95%
- = 1.9600 × √(0.52 × 0.48 / 600)
- = 1.9600 × 0.020396
- = 0.039976, or ±3.998 percentage points
The poll’s own p̂ goes in, 0.52, not 0.5. This close to an even split it hardly matters, since 0.5 also gives ±4.0 points, but on a lopsided question the headline margin, worked at 0.5, overstates the margin for that answer.
What is the margin of error when 4 of 200 parts are defective?
- E = z* × √(p̂(1 − p̂) / n), with z* = 1.9600 at 95%
- = 1.9600 × √(0.02 × 0.98 / 200)
- = 1.9600 × 0.0098995
- = 0.019403, or ±1.94 percentage points
The arithmetic gives ±1.9 points, but the margin should not be quoted. Only 4 parts are defective, below the 10 successes the Large Counts condition asks for, so p̂ is far from normal, and the interval of 0.0006 to 0.0394 sits almost against zero. The calculator warns about this case.
Common questions
What is the margin of error for a sample of 1,000?
About ±3.1 percentage points at 95% confidence, for a proportion near 0.5: z* × √(0.25 / 1000) with z* = 1.96. That is the widest margin a sample of 1,000 can have, since p̂(1 − p̂) peaks at 0.5. At 99% confidence the same sample gives about ±4.1 points.
Should I use z* or t* for the margin of error?
Use z* for a proportion, and for a mean when the population standard deviation σ is known. Use t* on n − 1 degrees of freedom for a mean whose standard deviation comes from the sample itself, which is the usual case. The difference matters most for small samples: at 95% confidence t* is 2.262 at n = 10 and 2.045 at n = 30, against z* = 1.960.
Why is a poll’s margin of error worked out at 50%?
Because p̂(1 − p̂) is largest at p̂ = 0.5, so the margin there is the widest any answer in the poll can have, and one figure then covers every question in the survey. A result far from 50% has a smaller margin of its own: at 10% or 90% it is 60 percent of the headline figure.
How do you find the margin of error from a confidence interval?
Halve the width of the interval: E = (upper bound − lower bound) / 2, and the estimate is the midpoint. An interval from 0.46 to 0.54 has a margin of error of 0.04 around an estimate of 0.50.
What is the difference between the margin of error and the standard error?
The standard error is the typical distance between an estimate and the true value from one random sample to the next: √(p̂(1 − p̂) / n) for a proportion, or s / √n for a mean. The margin of error is the standard error multiplied by a critical value, so it also depends on the confidence level. At 95% and with a large sample it is about twice the standard error.