Sample Size Calculator
Work out the sample size for a target margin of error at 90, 95 or 99% confidence, for a proportion or a mean, with the finite population correction.
Calculator
Your best guess at the true proportion, as a decimal. Leave at 0.5 without one: it gives the largest n, so the margin is met whatever the truth.
As a decimal: 0.03 for ±3 percentage points.
Leave at 0 for a population too large to matter, or not known. A real N applies the finite population correction.
- Sample size The smallest whole sample whose margin of error is at most E, so the formula’s answer rounded up.
- 1068
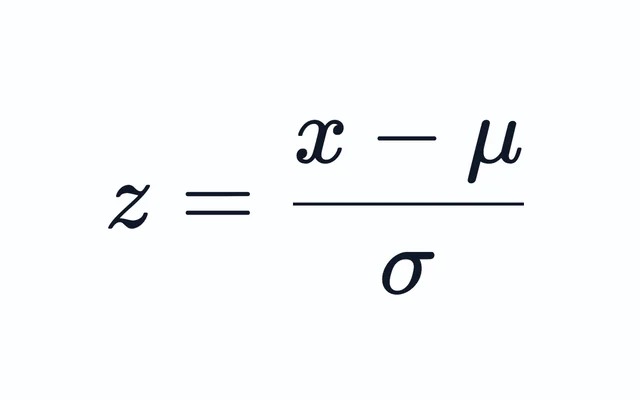
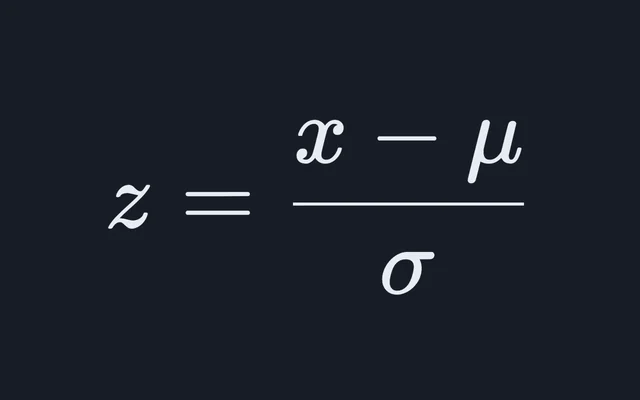
- Critical value z* The z for 95% confidence: 2.5% of the normal curve lies above it and 2.5% below its negative.
- 1.9600
- Before rounding up The formula’s answer. A sample is a whole number, and one below this would miss the margin, so it is rounded up whatever the decimal.
- 1067.07
- Margin this sample gives The margin of error at the rounded-up n. Rounding up makes it a little narrower than the target.
- 0.02999
Working, with your numbers
- n = z*² × p(1 − p) / E², with z* = 1.9600 at 95%
- = 1.9600² × 0.5 × 0.5 / 0.03²
- = 3.8415 × 0.25 / 0.0009
- = 1067.07, rounded up to 1068
Rounded up, never to the nearest: a sample one smaller would miss the margin. z* is used to full precision.
Citing this tool
Last updated . Add the date you accessed it as well, which a citation of a page that can change asks for. If a specific result matters, cite the permalink from the tool’s share row instead of this page: it reproduces the exact parameters.
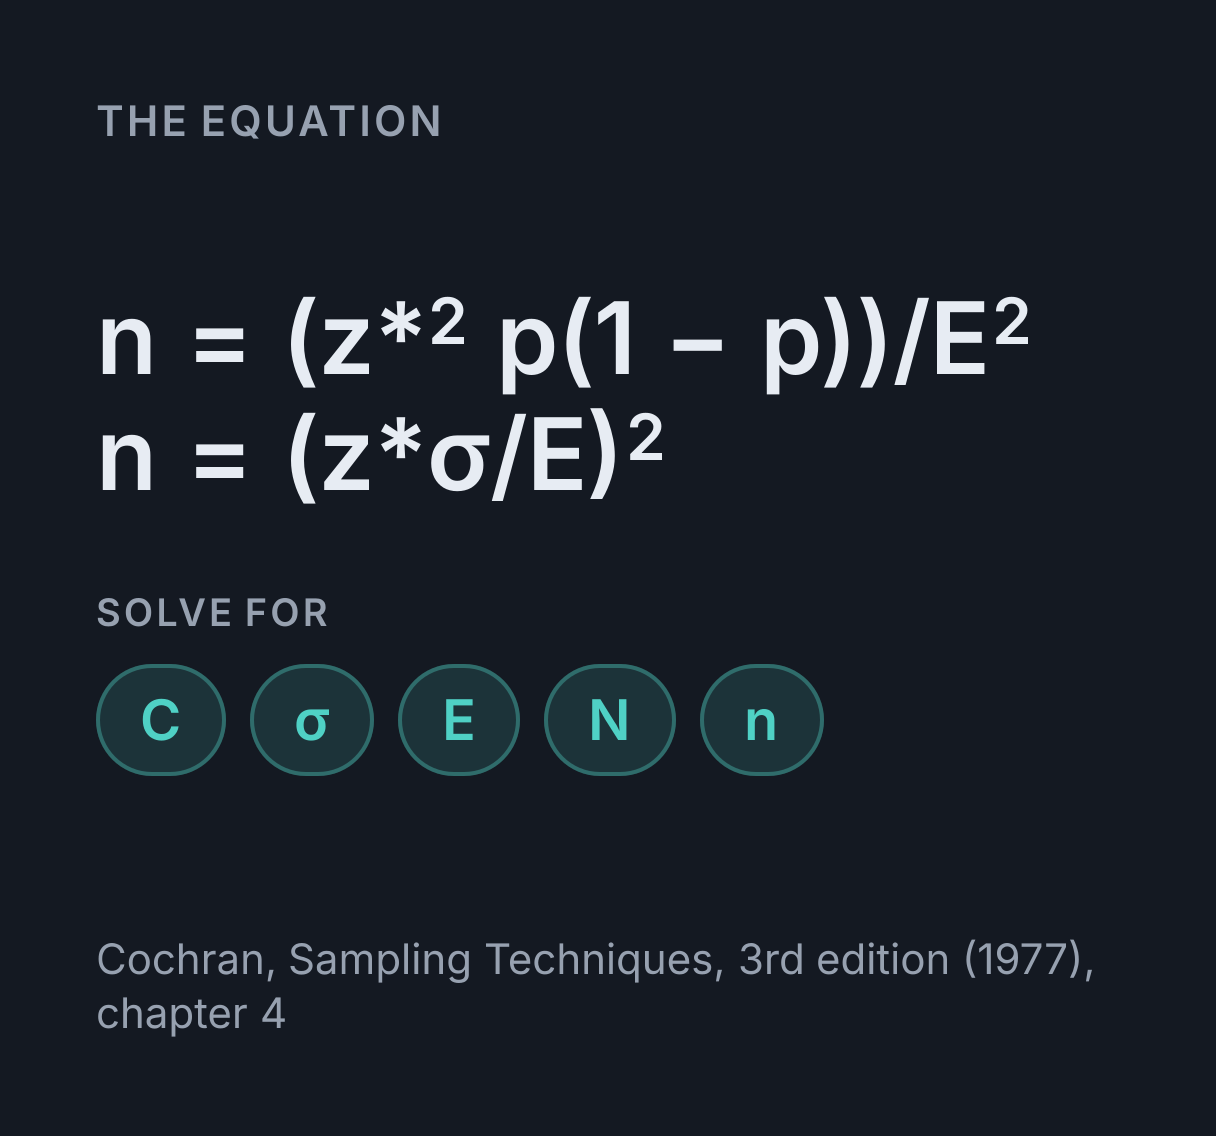
The equation
Cochran, Sampling Techniques, 3rd edition (1977), chapter 4
How do you calculate sample size?
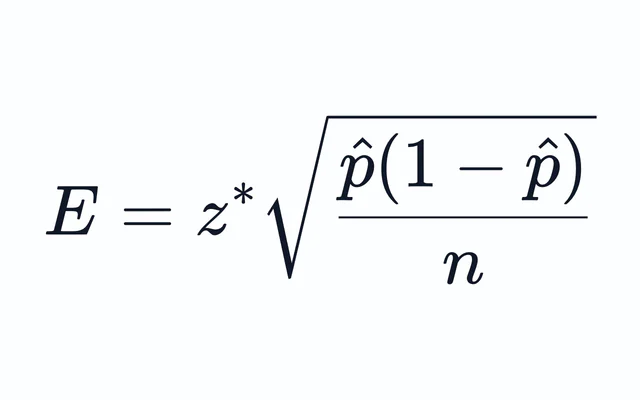
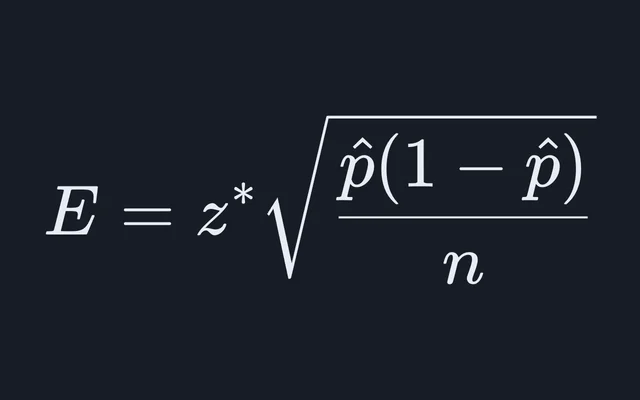
Solve the margin of error formula for n. For a proportion, n = z*² p(1 − p) / E², with p = 0.5 when there is no earlier estimate. For a mean, n = (z* σ / E)², with σ from a pilot study. Round the result up to the next whole number, then apply the finite population correction if the population is small.
Planning with p = 0.5
The proportion is unknown before the survey, which is the reason for running it, so the formula needs a planning value. p(1 − p) is largest at p = 0.5, which makes 0.5 the choice that delivers the margin whatever the truth turns out to be. An earlier survey or a pilot that puts p well away from 0.5 justifies a smaller sample:
| Planning p | 1 − p, same n | p(1 − p) | Sample size n |
|---|---|---|---|
| 0.5 | 0.5 | 0.25 | 1,068 |
| 0.4 | 0.6 | 0.24 | 1,025 |
| 0.3 | 0.7 | 0.21 | 897 |
| 0.2 | 0.8 | 0.16 | 683 |
| 0.1 | 0.9 | 0.09 | 385 |
A guess that is too far from 0.5 costs precision: plan on p = 0.1 when the truth is 0.3 and the finished margin is wider than intended. The cautious choice is the value closest to 0.5 that the evidence allows.
Why the answer is always rounded up
The formula returns the sample at which the margin equals the target exactly, which is rarely a whole number, and any smaller sample has a margin slightly wider than E. So the answer is rounded up even when the decimal is small: at ±5 points and 95 percent the formula gives 384.15, and the sample size is 385, not 384.
The critical value’s rounding can move the answer too. Textbooks that use z* = 1.645, 1.960 or 2.576 can land a unit or two from this calculator, which uses the unrounded values. For ±1 point at 90 percent the rounded z* gives 6,766 where the exact one gives 6,764, and the calculator shows the table figure beside its own whenever the two differ.
The finite population correction
The formulas above treat the population as unlimited. Sampling without replacement from a population of N removes uncertainty as it goes, since each unit sampled is one fewer left unknown, so a small population needs a smaller sample. Cochran’s corrections, applied to the uncorrected n₀ before rounding, are:
- for a proportion,
n = n₀ / (1 + (n₀ − 1) / N) - for a mean,
n = n₀ / (1 + n₀ / N)
They differ because each solves the margin formula under its own exact sampling variance, (PQ / n)(N − n) / (N − 1) for a proportion and (S² / n)(1 − n / N) for a mean. Many calculators use the second form for both. It always comes out lower by less than 1 before rounding, so the two never disagree by more than one respondent.
The correction matters only when the sample would be a sizable share of the population:
| Population N | Sample size n |
|---|---|
| 500 | 218 |
| 2,000 | 323 |
| 10,000 | 370 |
| 100,000 | 383 |
| Too large to matter | 385 |
Sample size for a mean
A mean needs a planning value for σ, the spread of the individual measurements, from a pilot study or earlier research. The answer scales with σ², so an optimistic σ leaves the sample too small. Planning uses z* even though the finished analysis usually uses t*, because t* depends on the n being worked out; below about 30, the t interval from the finished sample comes out slightly wider than planned.
A quality check on a lot of 600 packets wants the mean fill to within ±1.5 g at 99 percent confidence, and a pilot run gave σ = 8.5 g:
- n₀ = (z* × σ / E)², with z* = 2.5758 at 99%
- = (2.5758 × 8.5 / 1.5)²
- = 14.596²
- = 213.05
- n = n₀ / (1 + n₀ / N), for a population of N = 600
- = 213.05 / (1 + 213.05 / 600)
- = 157.22, rounded up to 158
Without the correction the plan would be 214 packets.
A sample of 158 is 26 percent of the lot, well past the 10 percent condition that an interval without the correction relies on, so the margin afterward should be worked with the same correction. The uncorrected formula would report a wider interval than the sample needs.
Common mistakes
- Typing the margin as a whole number. ±3 points is E = 0.03. Typing 3 asks for a margin of 300 percent, which the calculator refuses.
- Treating n as the number of people to contact. n counts usable responses. If a quarter of the people contacted respond, 385 responses means contacting 1,540.
- Forgetting the subgroups. A sample sized for ±3 points overall gives a wider margin for every subgroup reported on its own. Size the sample for the smallest subgroup that needs its own figure.
- Scaling the sample with the population. Past a few thousand, the population barely matters: from a population of 2,000 to one of 100,000, the sample grows from 323 to 383 while the population grows 50 times.
- Expecting a large sample to fix bias. A larger n shrinks only random sampling error. A frame that misses part of the population, or a low response rate among one group, stays biased at any sample size.
Worked examples
Each one runs through the calculator above, so the arithmetic here is the arithmetic it does.
How many people do you need to survey for a 3% margin of error at 99% confidence?
- n = z*² × p(1 − p) / E², with z* = 2.5758 at 99%
- = 2.5758² × 0.5 × 0.5 / 0.03²
- = 6.6349 × 0.25 / 0.0009
- = 1843.03, rounded up to 1844
At 95% the same ±3 points needs 1,068, so the move to 99% costs 73 percent more responses. The sample grows with z*², and z* rises from 1.960 to 2.576.
What sample size do you need from a population of 500 for a 5% margin of error?
- n₀ = z*² × p(1 − p) / E², with z* = 1.9600 at 95%
- = 1.9600² × 0.5 × 0.5 / 0.05²
- = 3.8415 × 0.25 / 0.0025
- = 384.15
- n = n₀ / (1 + (n₀ − 1) / N), for a population of N = 500
- = 384.15 / (1 + 383.15 / 500)
- = 217.49, rounded up to 218
Without the correction the answer would be 385, more than three quarters of the population. Sampling without replacement from only 500 removes uncertainty as it goes, and Cochran’s correction for a proportion turns that into 218.
What sample size gives a 2% margin of error if you expect about 10% to say yes?
- n = z*² × p(1 − p) / E², with z* = 1.9600 at 95%
- = 1.9600² × 0.1 × 0.9 / 0.02²
- = 3.8415 × 0.09 / 0.0004
- = 864.33, rounded up to 865
With no estimate, p = 0.5 would call for 2,401 at ±2 points. An earlier result near 10 percent cuts that to 865, because p(1 − p) is 0.09 rather than 0.25. The saving holds only if the true proportion really is near 0.1; nearer 0.5, the finished margin will be wider than planned.
Common questions
How many people do I need to survey?
At 95% confidence with no earlier estimate of the proportion, 385 completed responses give a margin of ±5 percentage points, 1,068 give ±3 and 9,604 give ±1. Those figures assume a population much larger than the sample, and a small population needs fewer. They count usable responses, so divide by the expected response rate to find how many people to contact.
Does a larger population need a larger sample?
Barely, once the population is in the thousands. For ±5 points at 95% confidence, a population of 500 needs 218, a population of 10,000 needs 370 and an unlimited one needs 385. The sample size is set by the margin and the confidence level; the population matters only when the sample would be a large share of it.
Why use p = 0.5 when calculating sample size?
p(1 − p) is largest at p = 0.5, where it equals 0.25, so planning with 0.5 gives a sample that meets the margin whatever the true proportion is. An earlier result near 10% or 90% justifies planning with that value instead, which cuts the sample to 36 percent of the p = 0.5 figure before rounding.
Why is sample size always rounded up?
Because any sample smaller than the formula’s answer has a margin wider than the target. For ±5 points at 95% confidence the formula gives 384.15, so the sample size is 385: rounding to the nearest whole number would give 384 and just miss the target.
What is the finite population correction?
An adjustment for sampling without replacement from a population of known size N, which needs fewer units than an unlimited population because each unit sampled removes some uncertainty about the rest. Cochran’s form for a proportion is n = n₀ / (1 + (n₀ − 1) / N) and for a mean n = n₀ / (1 + n₀ / N), each applied to the unrounded n₀ before rounding up.