Statistics and Probability Calculators
Standard deviation and SEM, z-scores and normal probabilities, chi-square tests, regression with standard errors, error propagation and probability.
18 tools in 8 groups
Describing data
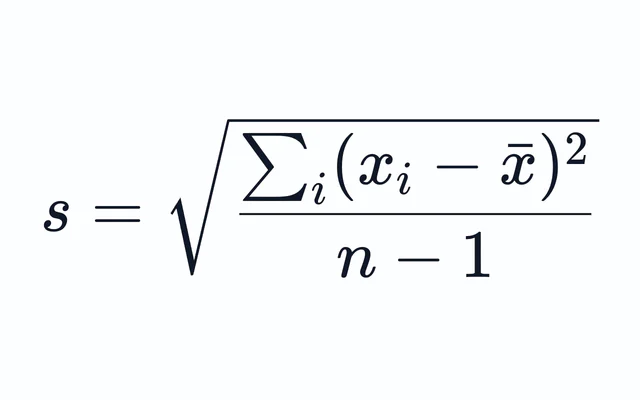
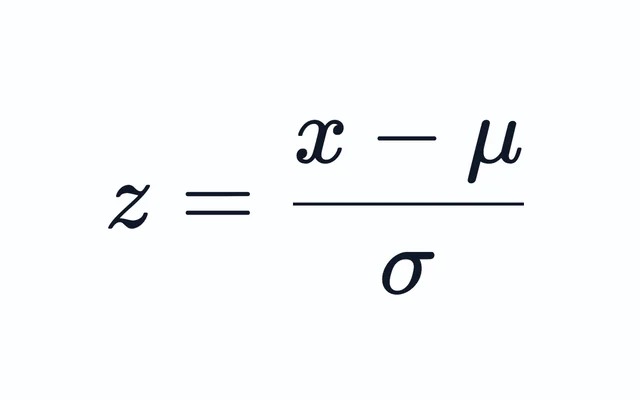
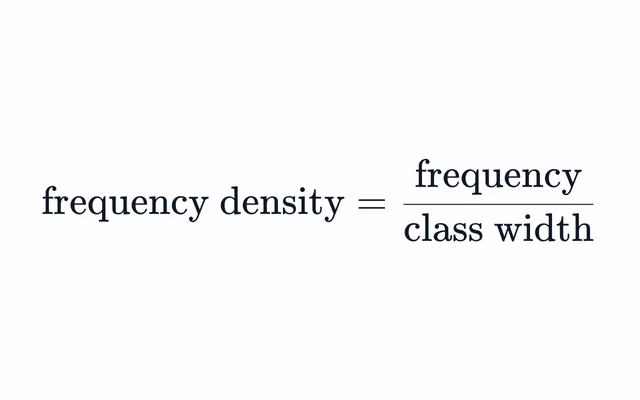
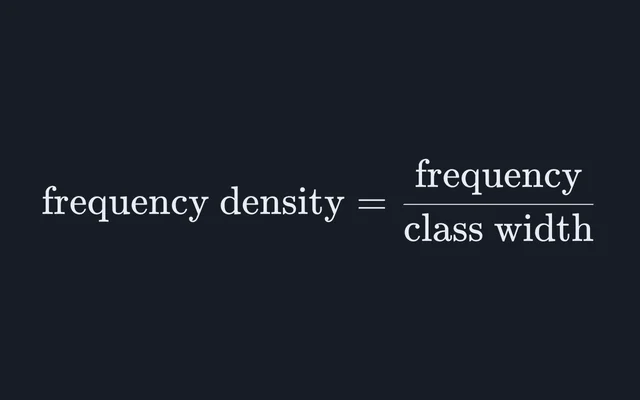
Spread and the standard error, probabilities and z-scores under the normal curve, and histograms with unequal class widths.
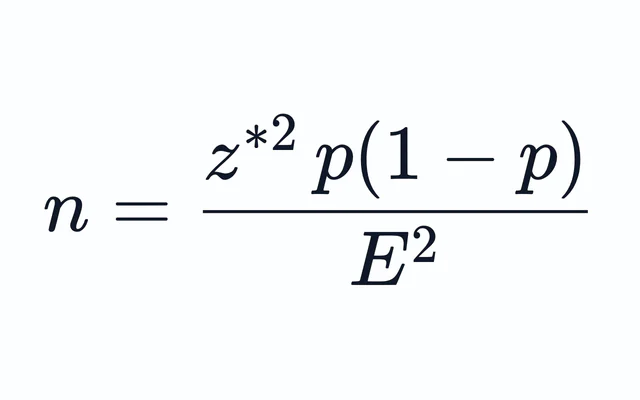
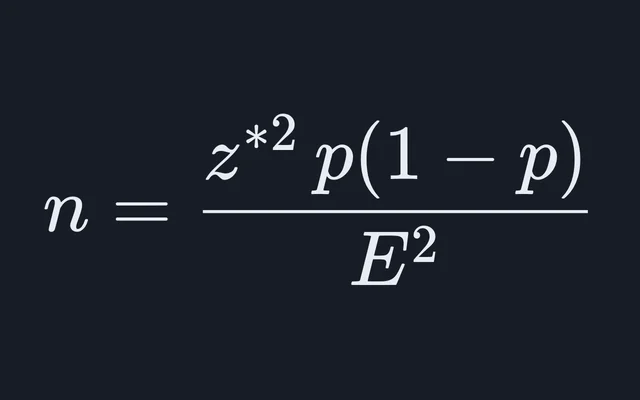
Margin of error and sample size
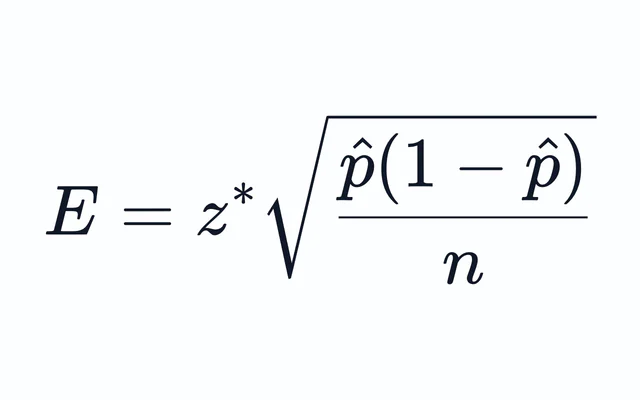
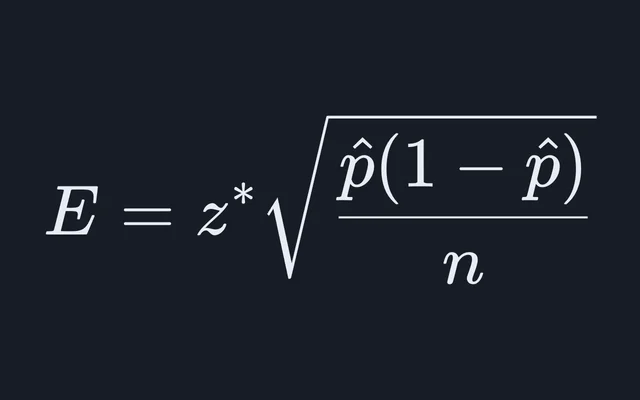
The margin of error for a proportion or a mean at 90, 95 or 99 percent confidence, and the sample size that keeps it within a target.
Comparing means
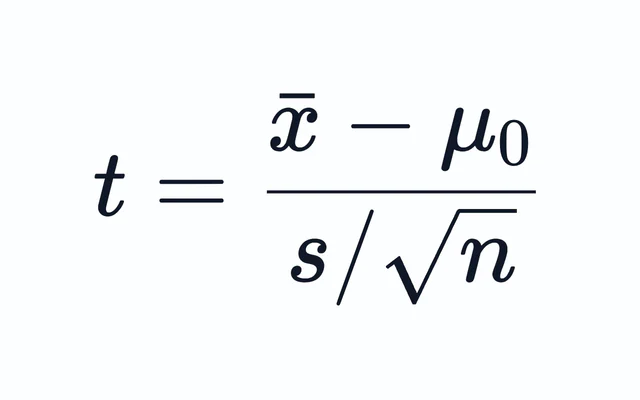
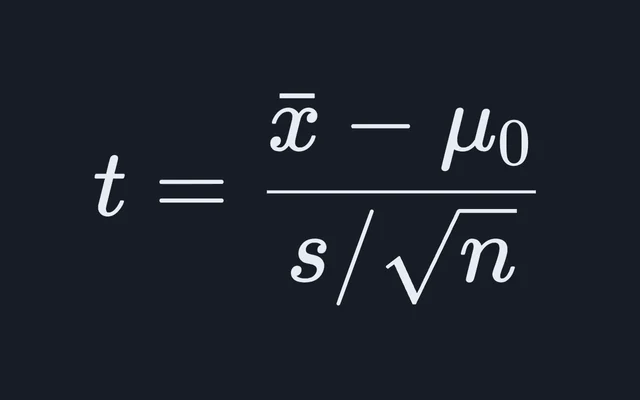
One-sample, two-sample and paired t-tests, with the p-value, the critical value and a confidence interval for the difference.
Chi-square tests
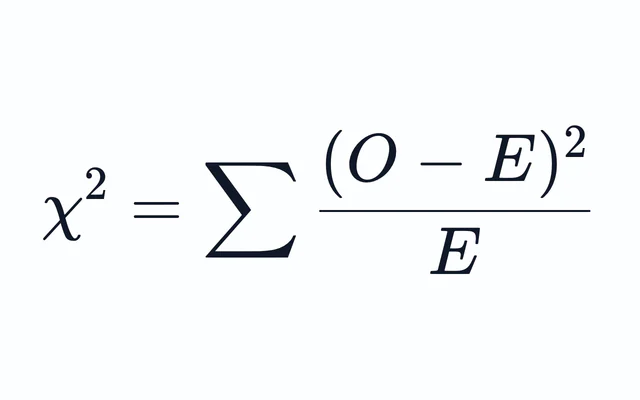
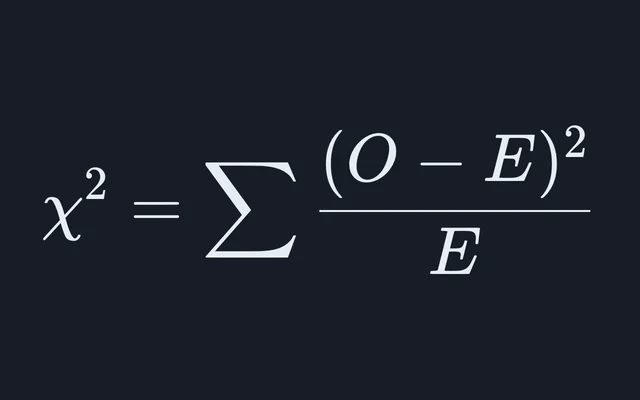
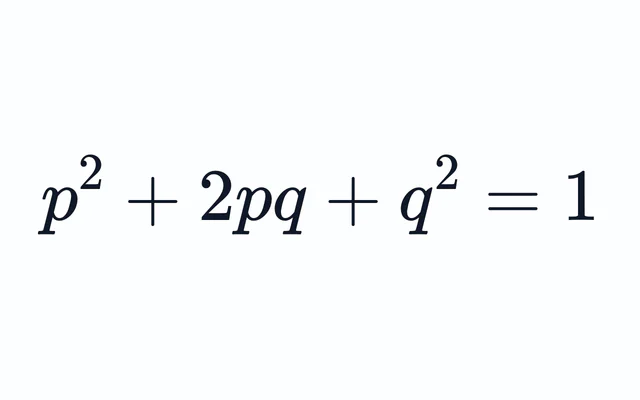
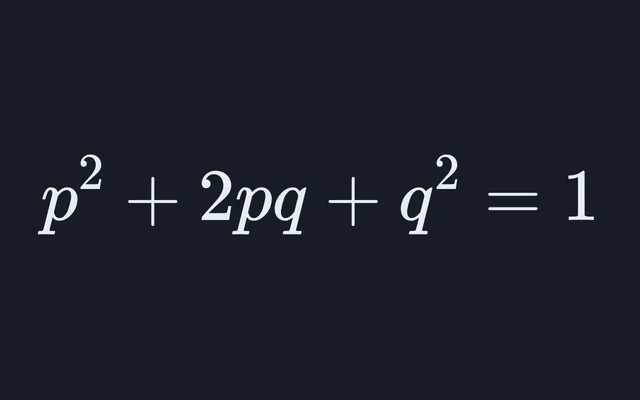
Observed counts against expected ones, for goodness of fit, independence and Hardy-Weinberg equilibrium.
Regression and correlation
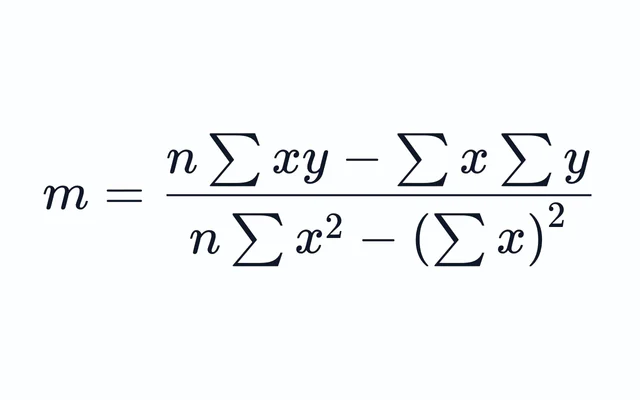
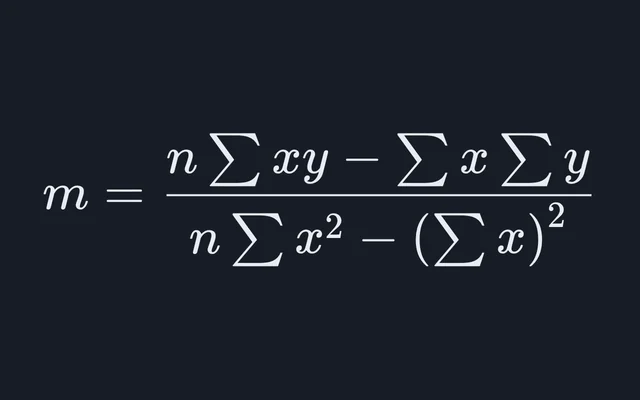
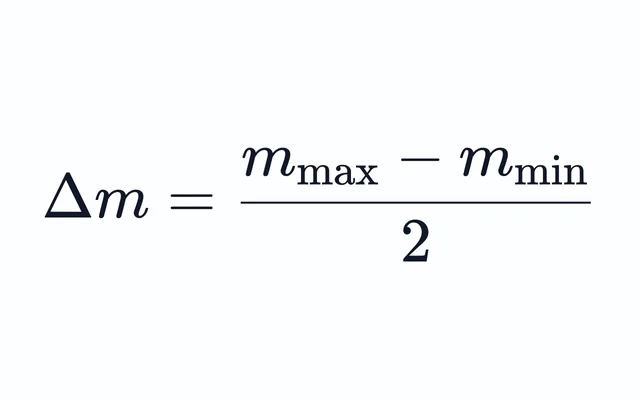
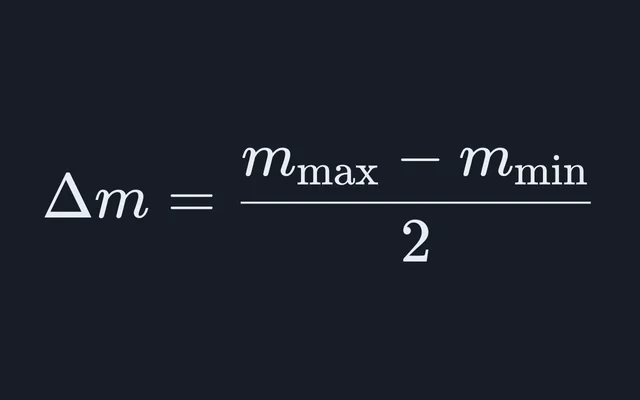
A least-squares line with standard errors, r and r², and best and worst fit lines through error bars.
Measurement error and uncertainty
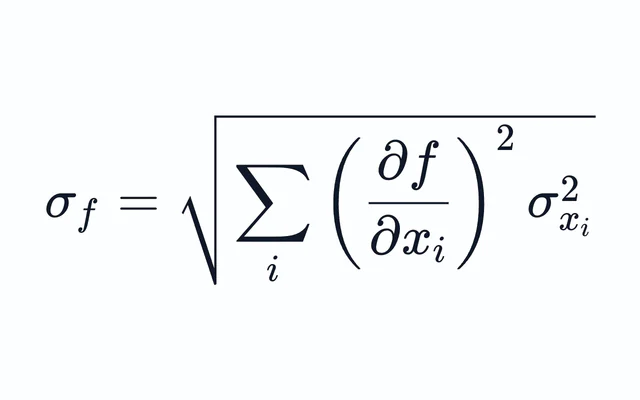
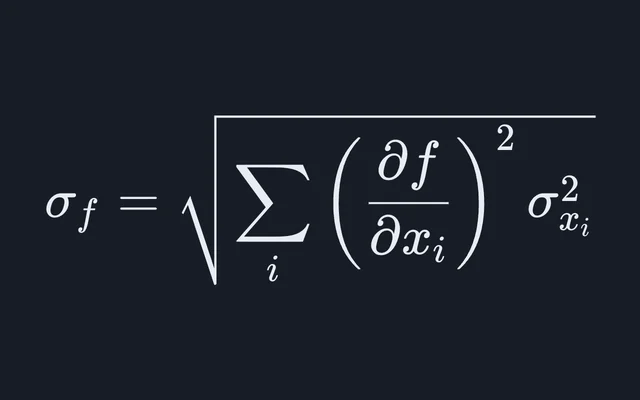
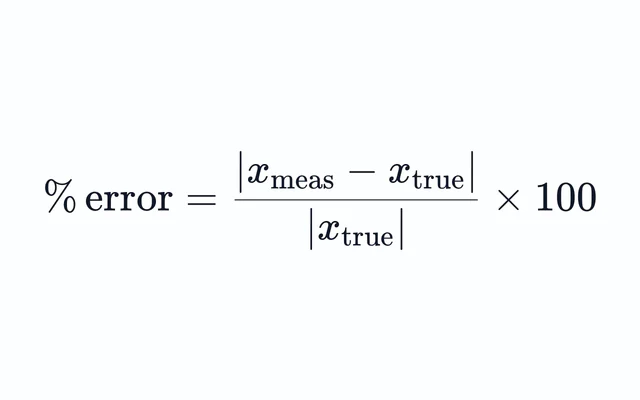
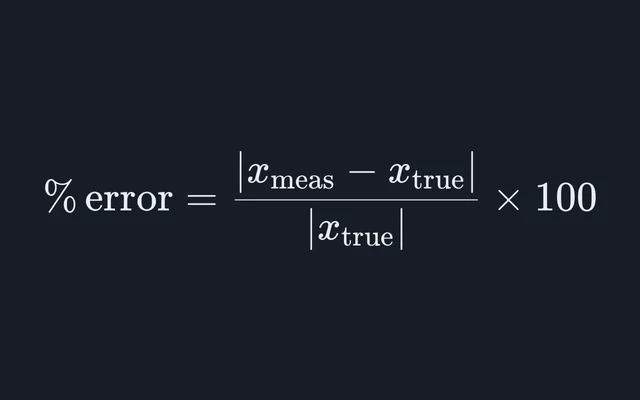
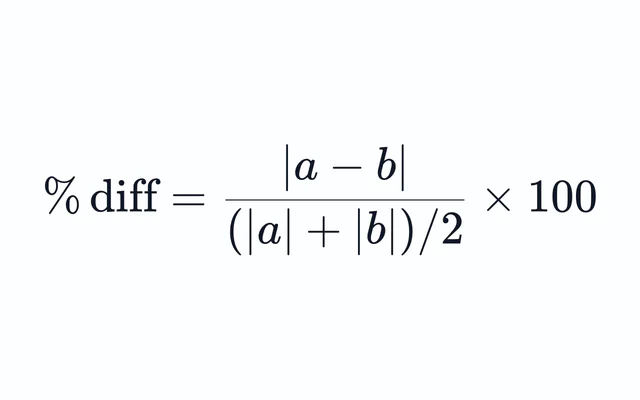
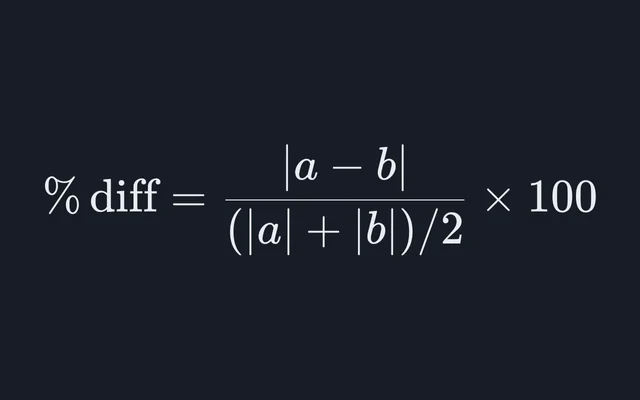
How far a result sits from the accepted value or from a second result, and how uncertainty carries through a formula.
Probability
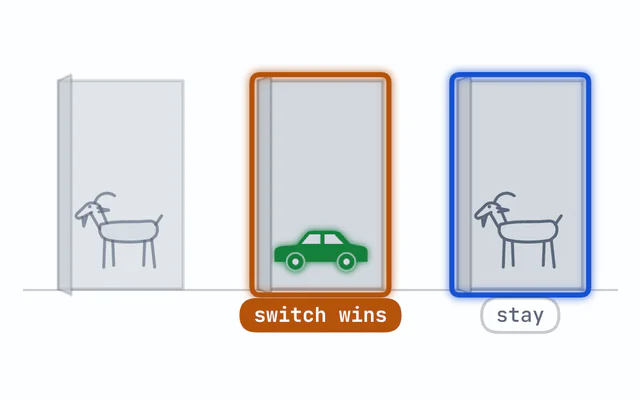
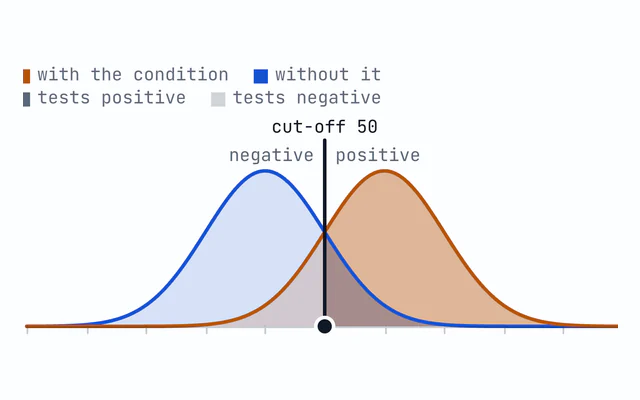
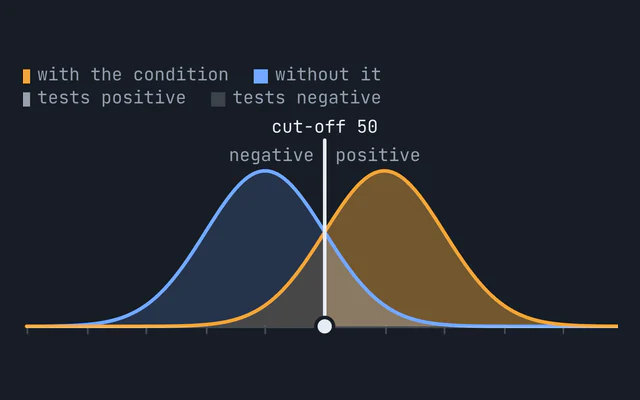
The Monty Hall problem over thousands of games, and what prevalence does to a test’s predictive values.

Population and diversity estimates
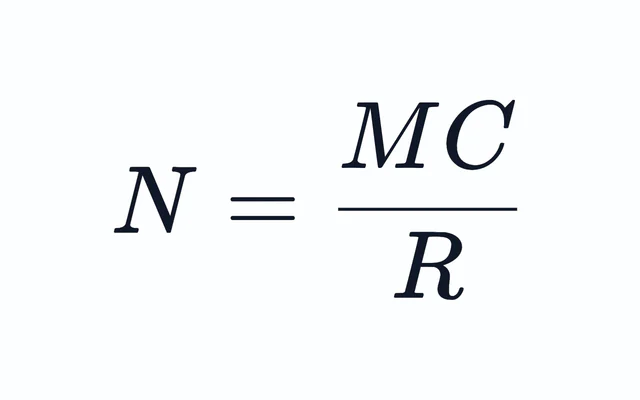
Population size from mark and recapture, and species diversity from counts.
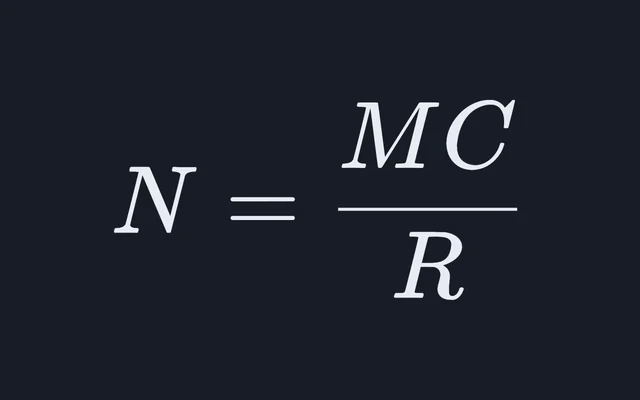
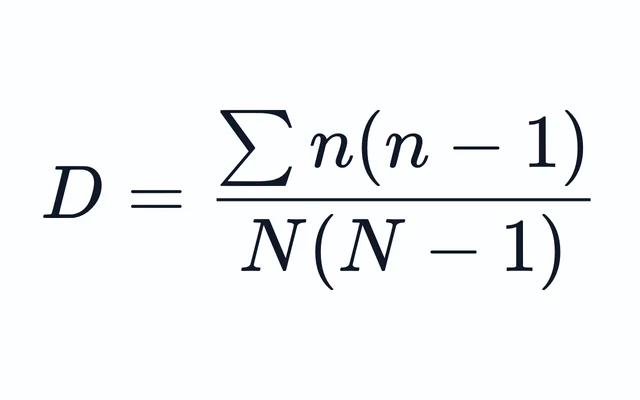
The calculators take data in the form a lab or a problem set gives it: paste a column of measurements for the standard deviation, two columns for a regression line, or type a table of counts into the chi-square test. Each names its method and its source, from Pearson’s 1900 chi-squared test to the GUM, the international guide to expressing uncertainty in measurement.
Two tools here deal in probability rather than data. The Monty Hall simulator plays thousands of games so you can watch staying settle at 1/3 and switching at 2/3, and the sensitivity and specificity tool shows how a rare condition can leave most positive results from a good test false.
Which statistical test should I use?
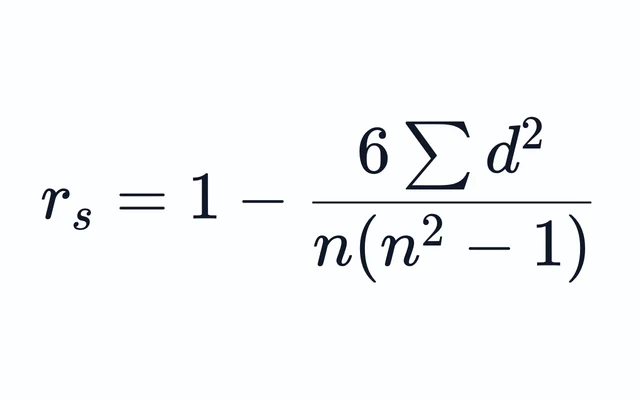
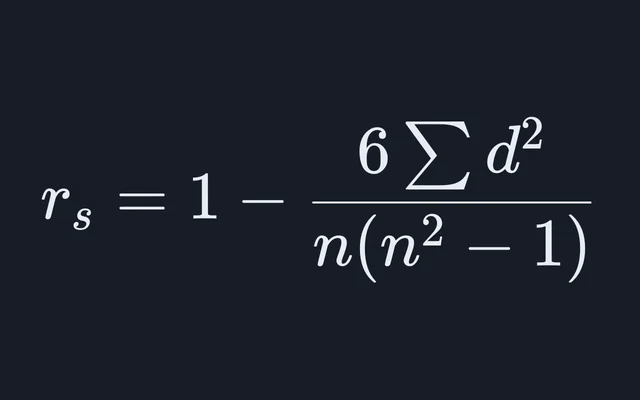
Start from the data. Counts in categories, compared with expected numbers or across a contingency table, call for a chi-square test. Comparing one or two means calls for a t-test. For two measured variables, fit a least-squares line and read r; if the data are ranks, or rise or fall without following a straight line, use Spearman’s rank correlation.
Uncertainty in a lab report
A lab report needs three things from one set of readings: the spread, the uncertainty in the mean, and how that uncertainty carries into a calculated result. The standard deviation calculator gives the first two, with a 95% confidence interval built on t rather than 1.96. The error propagation calculator carries uncertainties through sums, products and powers by the GUM’s first-order rule, and the worst-fit line gives the uncertainty in a gradient the way the IB Physics guide asks for it.
Statistics in genetics and ecology
The Hardy-Weinberg calculator runs a chi-square test of equilibrium on genotype counts. The mark-recapture calculator estimates a population by the Lincoln-Petersen index and Chapman’s estimator, with a standard error and a 95% interval, and Simpson’s index turns species counts into a measure of diversity, with Shannon’s H′ beside it.