Clinical Calculators and Physiology Simulators
MAP, eGFR, QTc, A-a gradient, corrected calcium and osmolality calculators that name their equation, with physiology simulators and 3D anatomy.
49 tools in 4 groups
All 22 calculators
Blood gas
Kidney and electrolytes
Heart and circulation
Body size and fitness
Physiology simulators
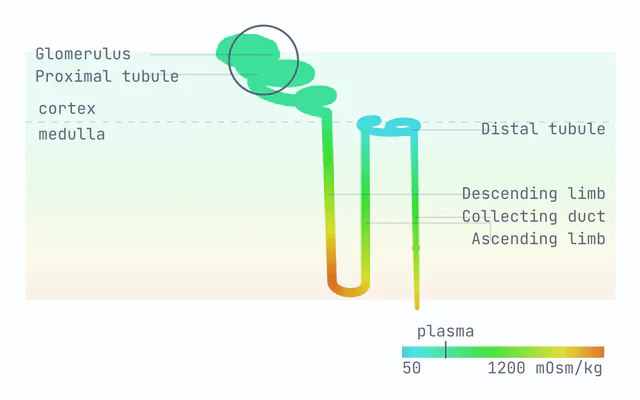
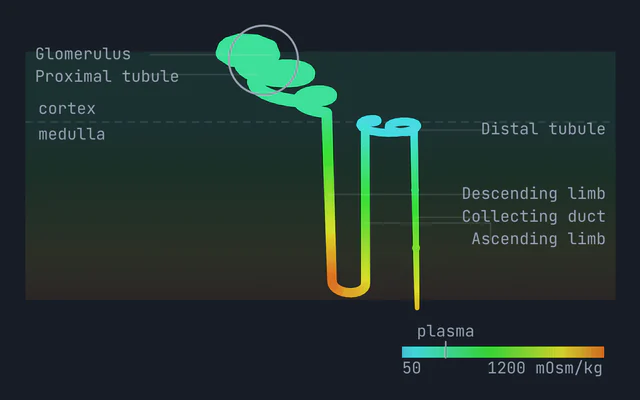
Models of the systems behind the numbers: heart, lungs, blood, kidney, nerve, muscle, hormones and drug levels.
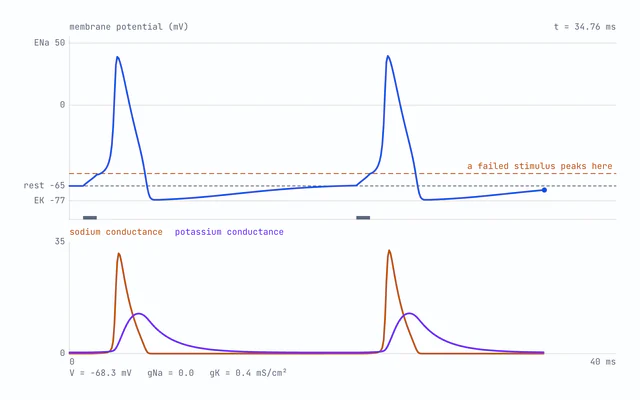
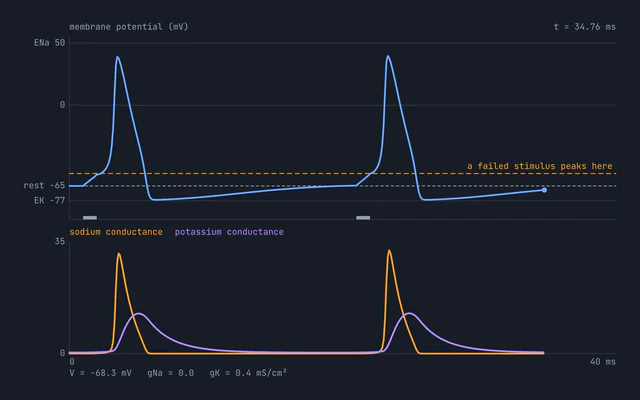
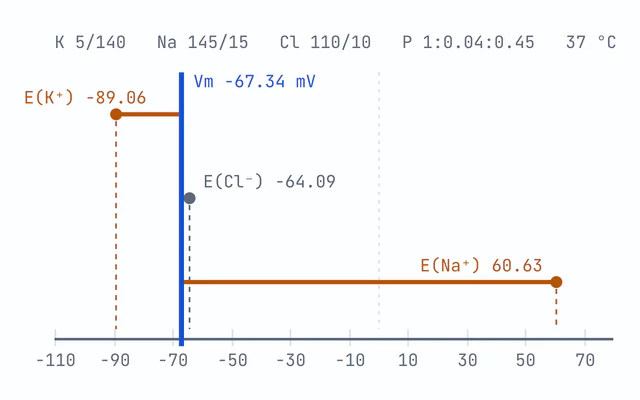
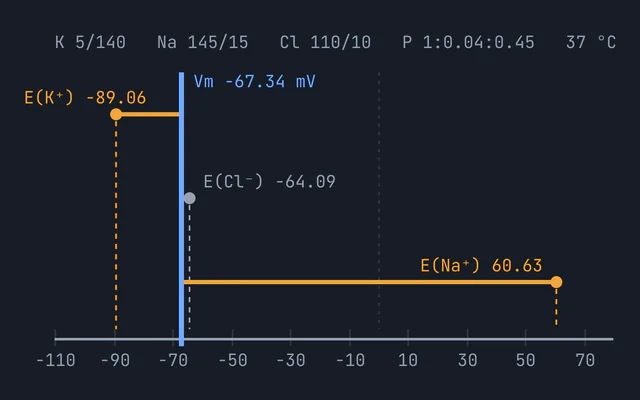
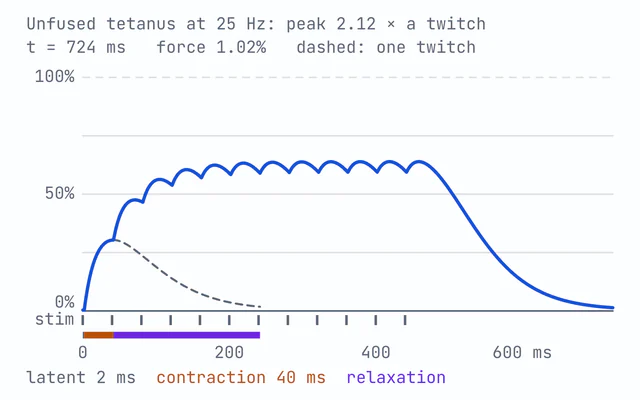
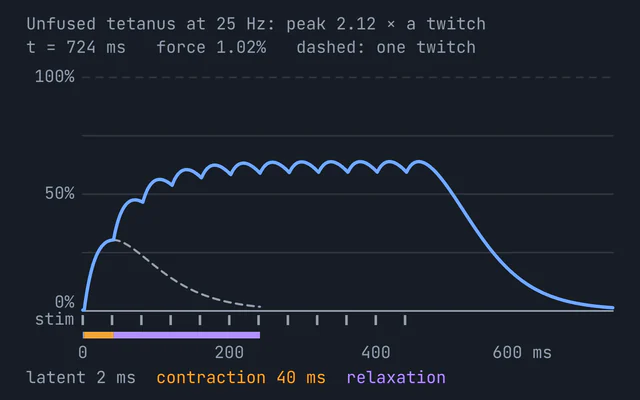
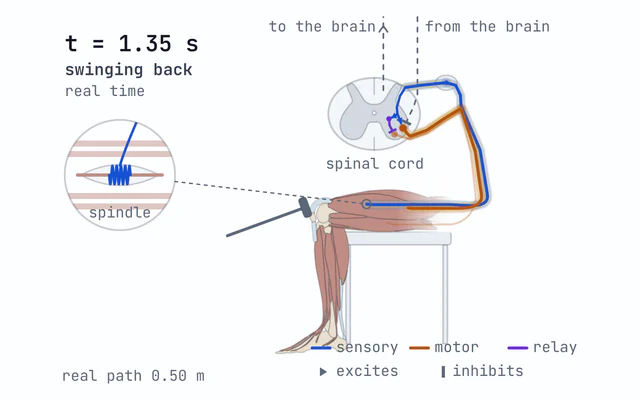
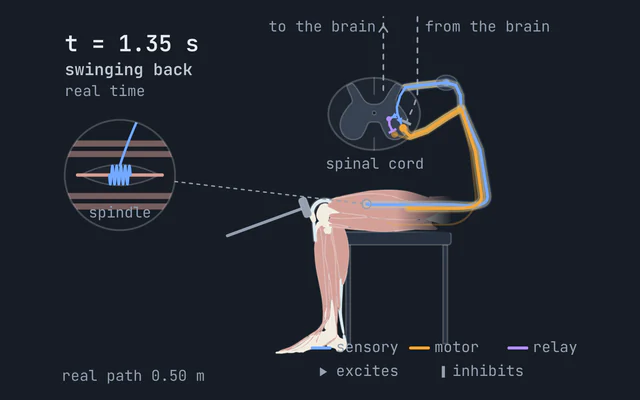
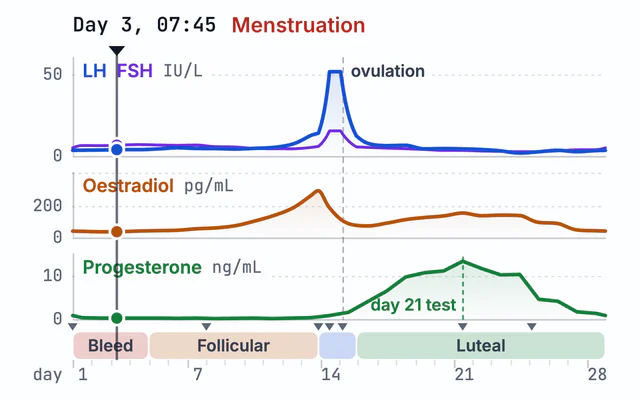
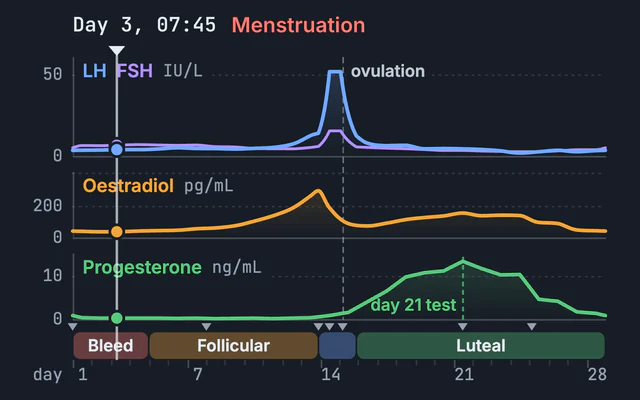
Reflex Arc Simulator: picture drawn from BodyParts3D, © The Database Center for Life Science, CC BY 4.0.
Anatomy
3D models to turn and take apart, with the dermatome, visual pathway and elbow vein maps.
All 37 3D anatomy models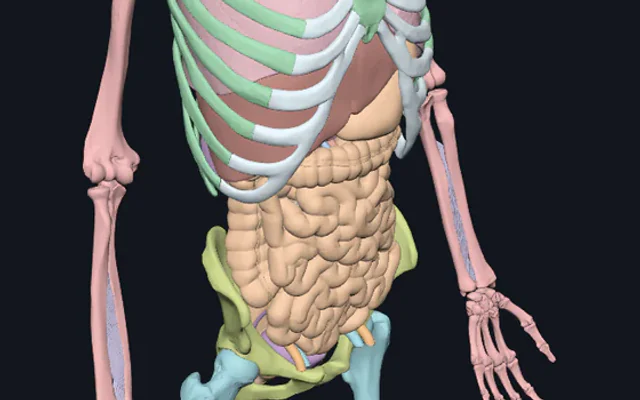
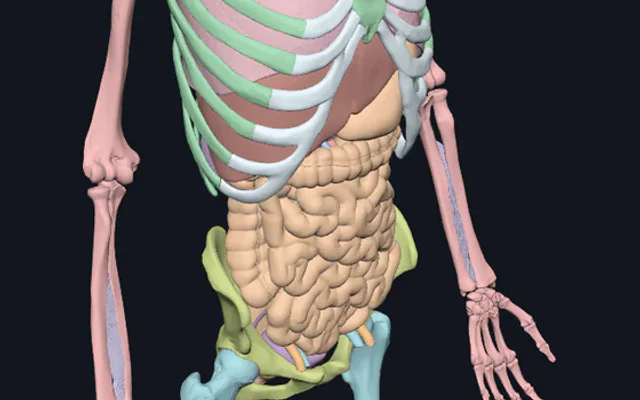
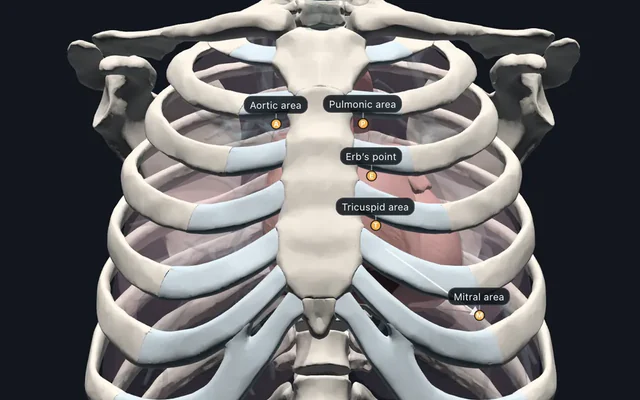
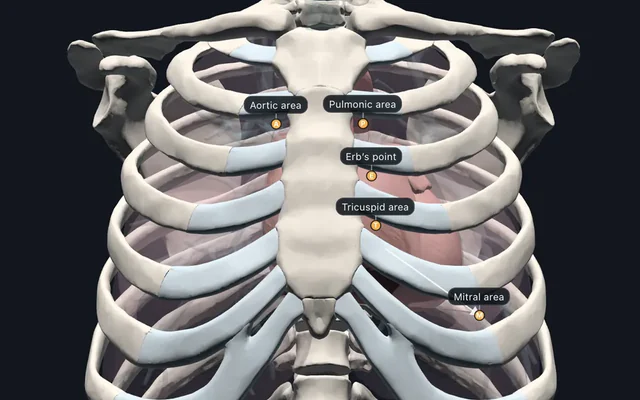
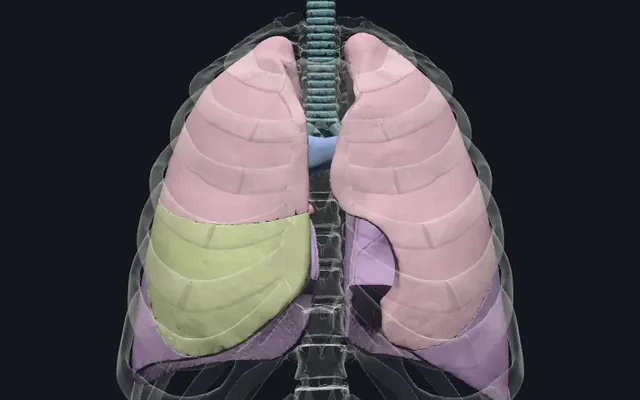
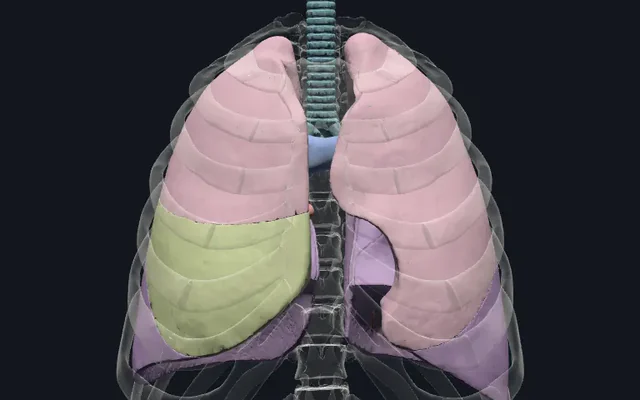
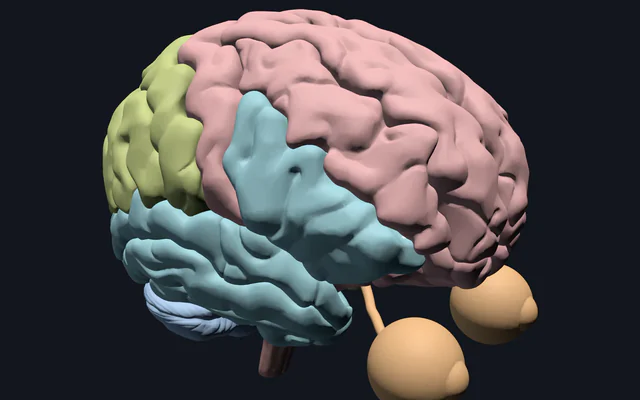
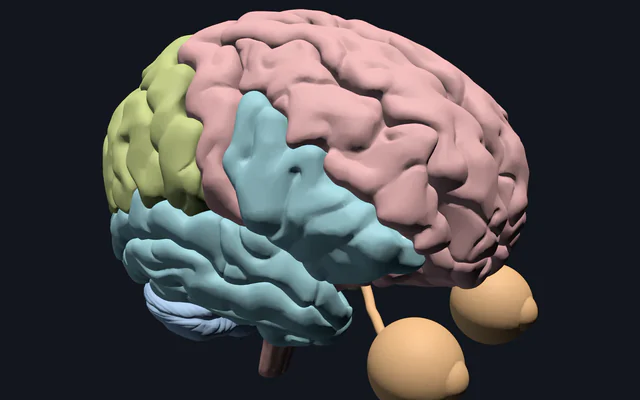
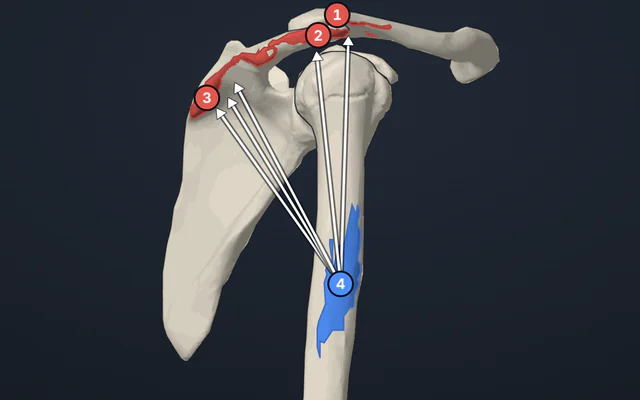
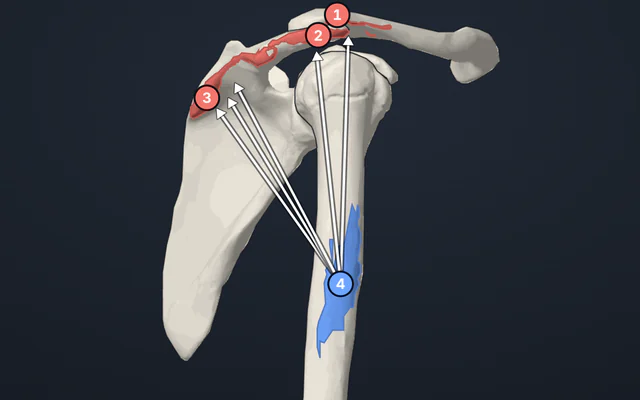
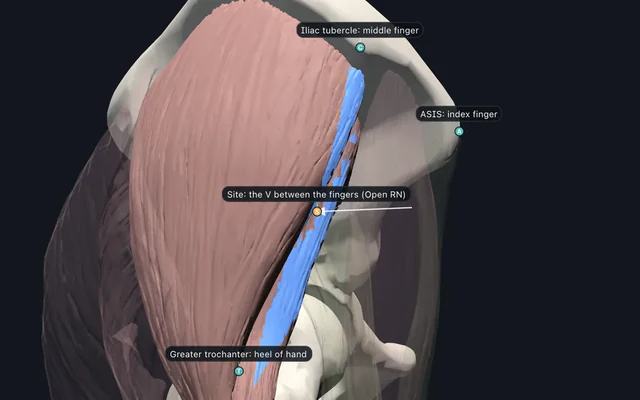
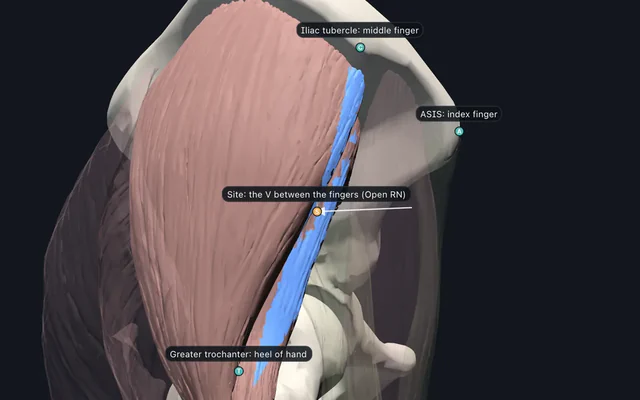
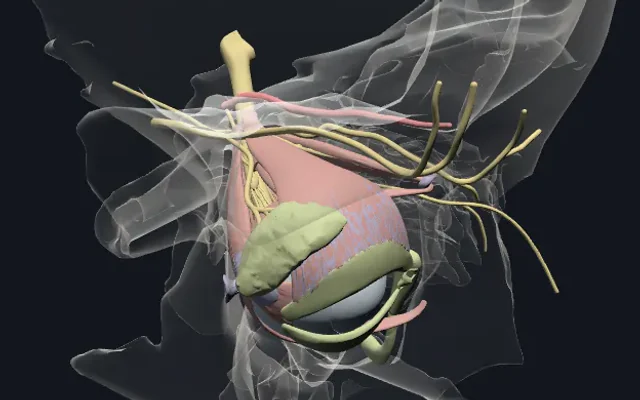
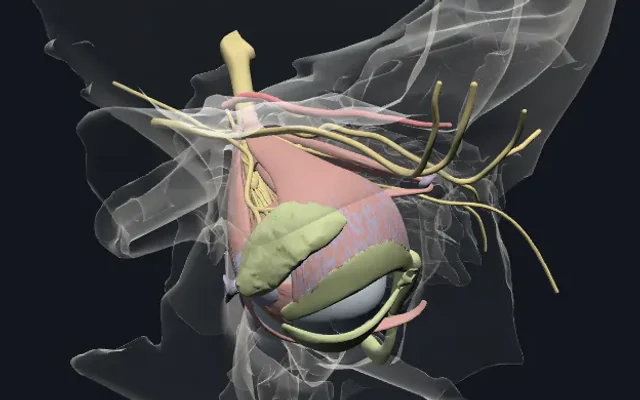
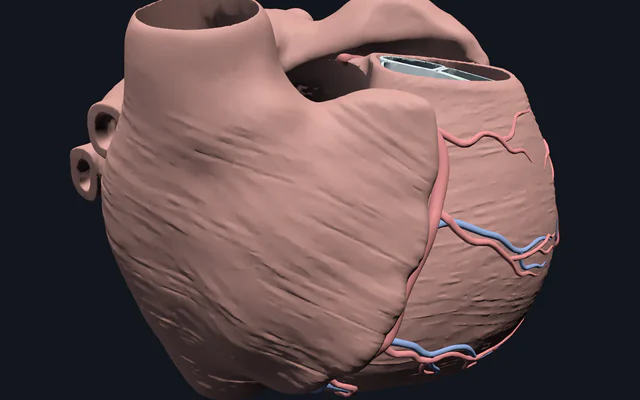
Full Body Explorer, Heart Explorer, Heart and Lung Auscultation Points Explorer, Lungs and Bronchial Tree 3D Explorer, Brain Explorer, Muscle Origin, Insertion and Action Explorer, Intramuscular Injection Sites 3D Explorer and Eye and Extraocular Muscles 3D Explorer: pictures drawn from BodyParts3D, © The Database Center for Life Science, CC BY 4.0.
Bedside calculators
Formulas for the numbers on a ward round, each with its equation and source cited on the page.
Practice and biostatistics
Generated calculation questions marked as you answer, and the statistics of a diagnostic test.
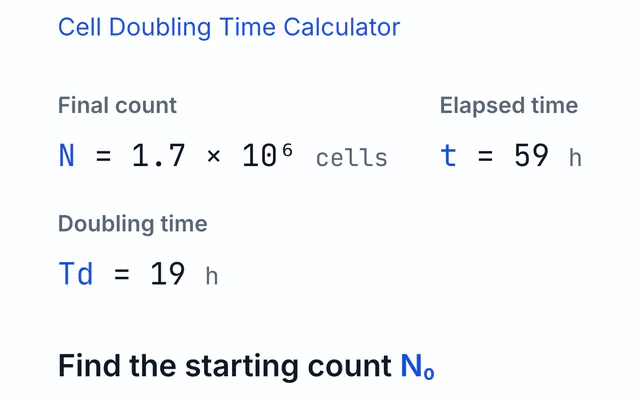
The calculators run competing equations side by side where clinicians use more than one: four QT corrections, four body surface area formulas, and CKD-EPI 2021, MDRD and Cockcroft-Gault on the same creatinine. A dose or a threshold can depend on which one a hospital adopted, so you can see how far they disagree for the same inputs.
Each bedside calculator carries the same caution on its page. Its reference ranges are typical, and your laboratory’s may differ. The unit on the report decides what goes in: American and Indian reports mostly use mg/dL, while British, Canadian and Australian reports use mmol/L or µmol/L.
What is a clinical calculator?
A clinical calculator turns a measurement from the bedside or the laboratory into a derived value through a published equation: a blood pressure into mean arterial pressure, a creatinine into an estimated GFR, a QT interval into a rate-corrected QTc. Each calculator here names its equation and source, so the result can be checked against a textbook.
Physiology simulators, for the mechanism behind a number
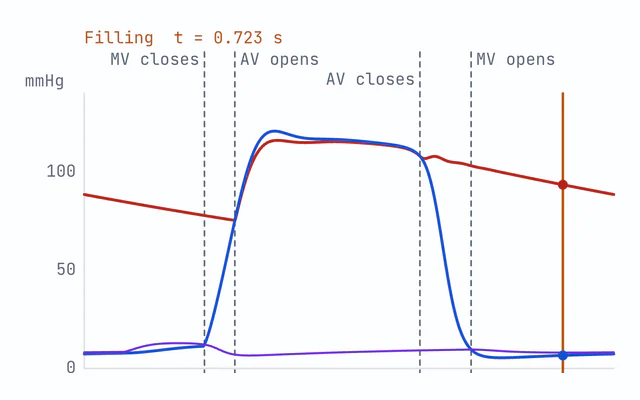
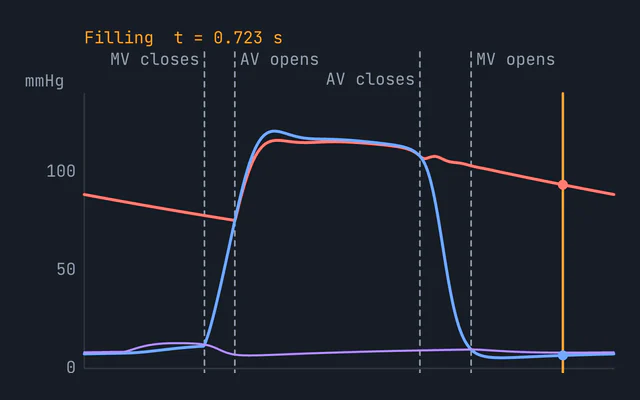
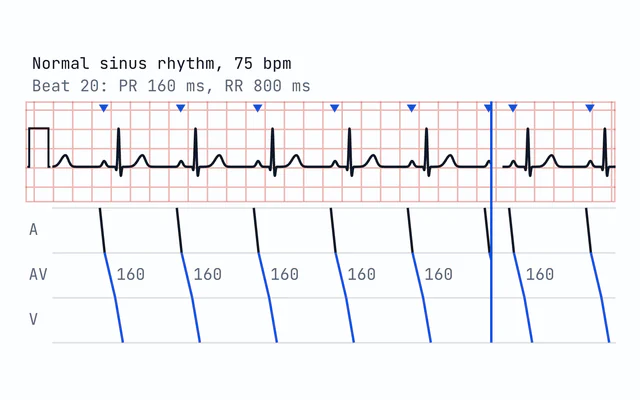
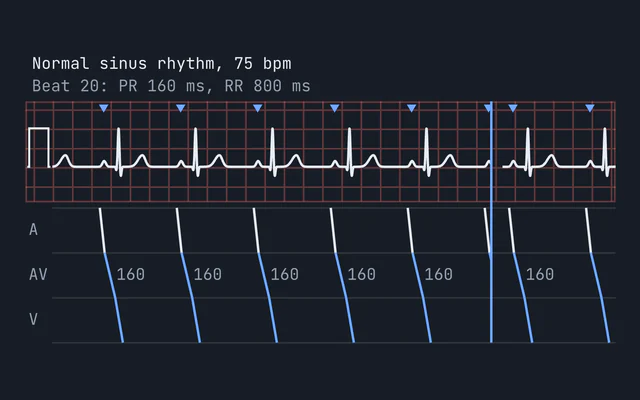
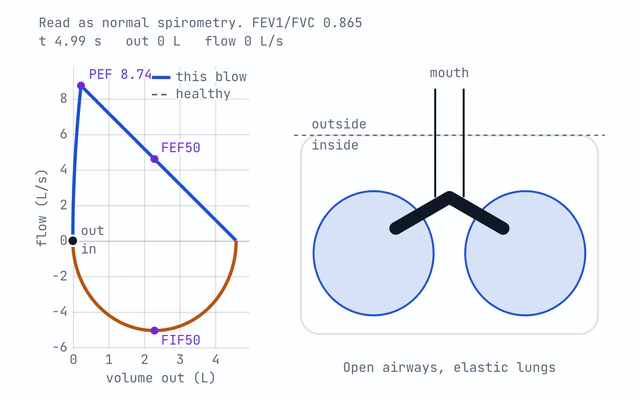
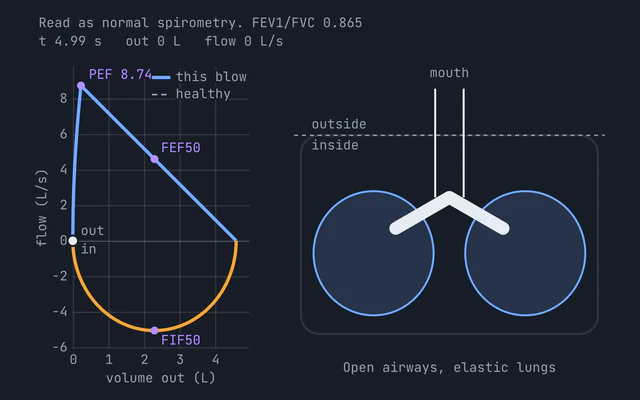
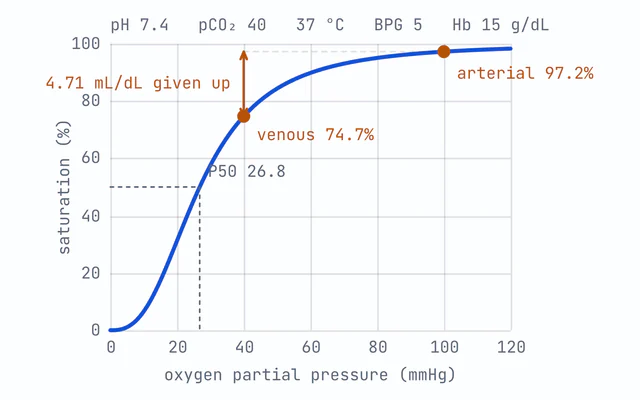
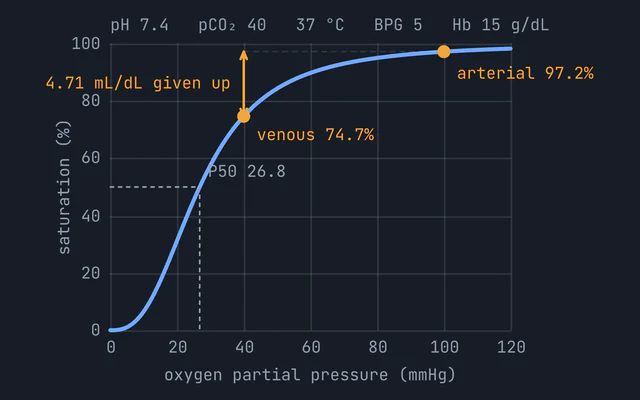
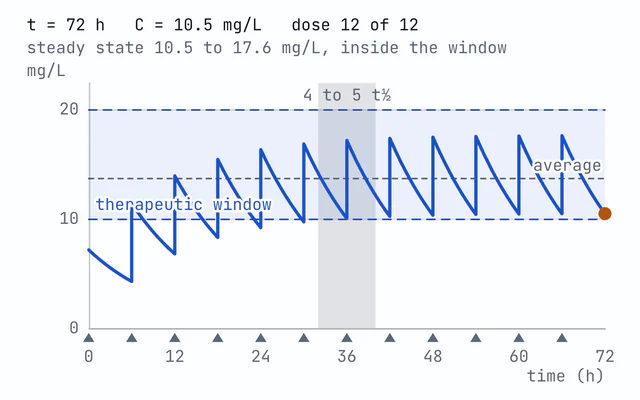
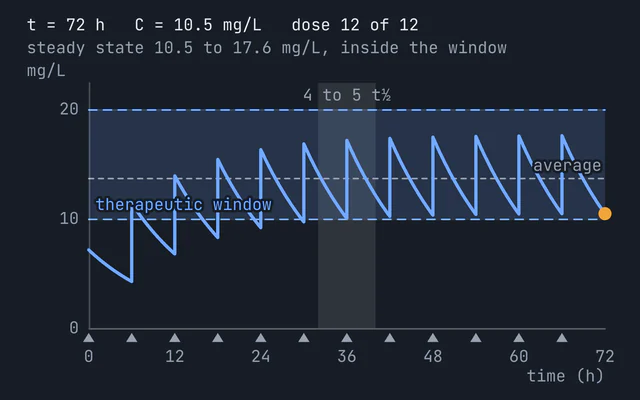
The simulators model a textbook system rather than a patient. The cardiac cycle lines up pressures, volume, valves and the ECG on a Wiggers diagram; the rhythm simulator sweeps a lead II strip through the heart blocks, atrial fibrillation and flutter; the spirometry simulator draws obstructive and restrictive flow-volume loops; and the oxygen dissociation curve shifts with pH, carbon dioxide, temperature and 2,3-BPG.
Each one shows the mechanism a calculated value depends on, so you can watch a fall in pH shift the oxygen curve or a dropped beat appear on the strip.
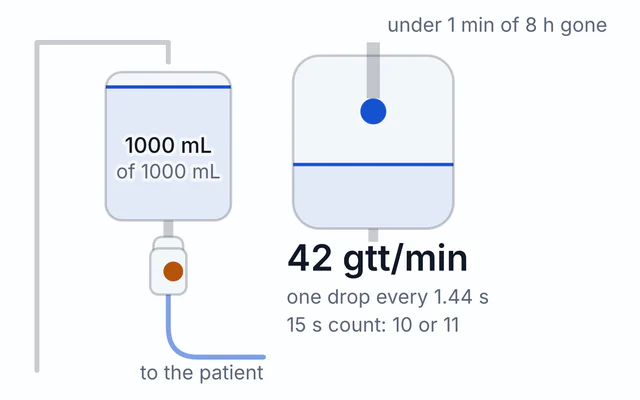
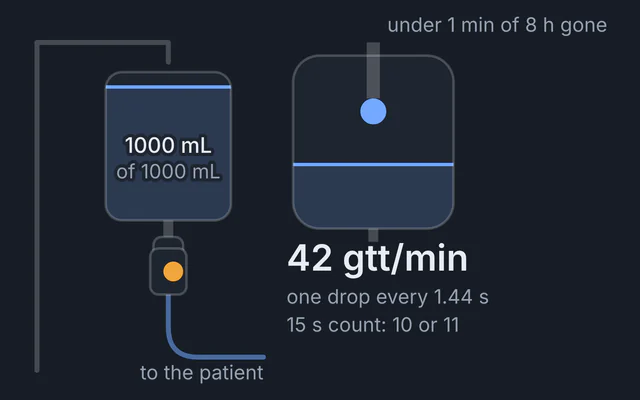
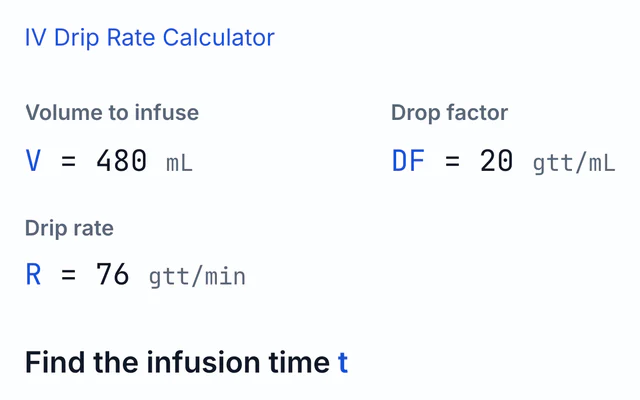
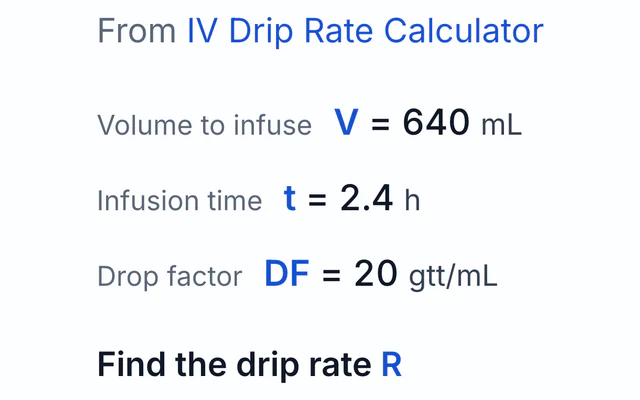
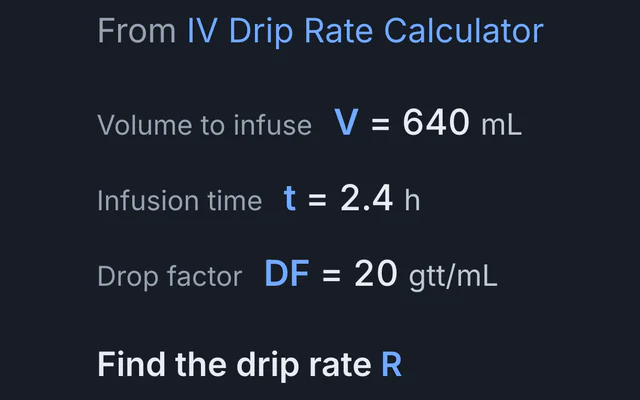
The IV drip simulator does the same for an infusion order: drops fall at the real gtt/min for the volume, the time and the drop factor as the bag empties, and the same order runs on a pump in mL/h.
Anatomy in 3D, and the neurological maps
The anatomy explorers are 3D models built from the BodyParts3D meshes: peel the full body from skin to skeleton, hide the heart wall to see the valves, or take the brain apart into named gyri, deep structures and ventricles.
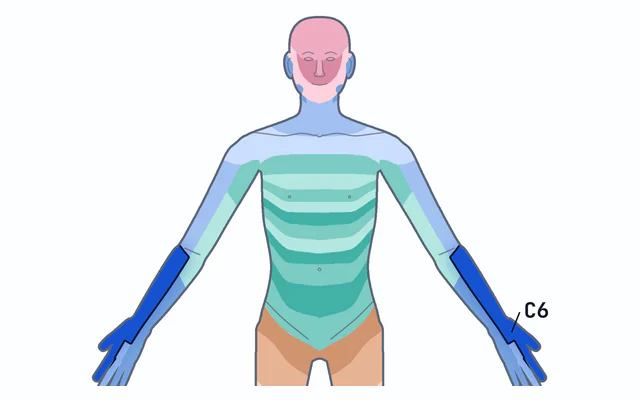
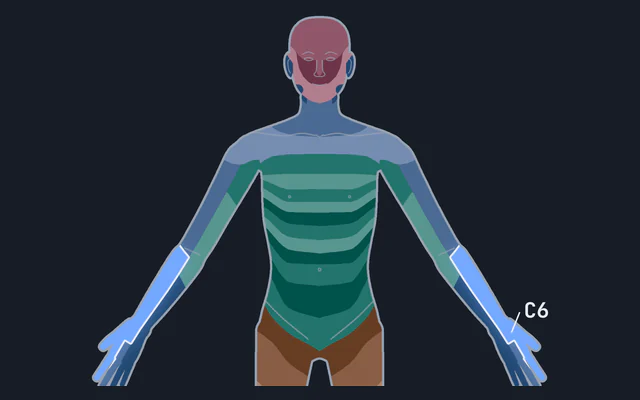
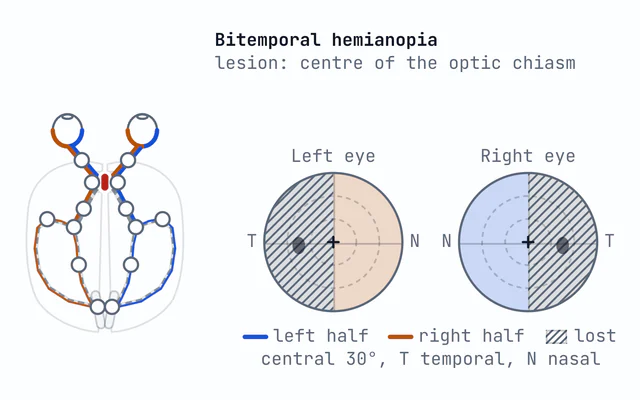
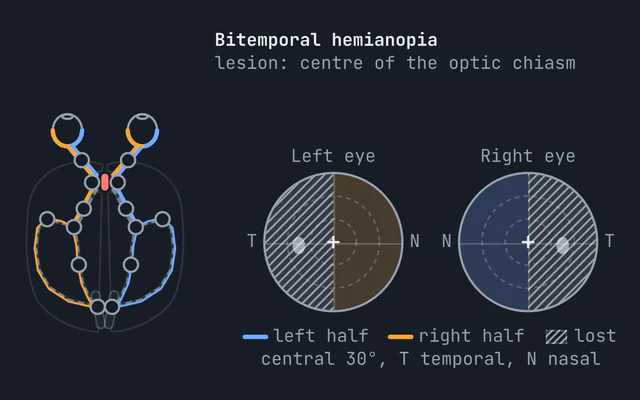
Two diagrams sit beside them for the neurological examination. The dermatome map lights each spinal root’s band of skin from C2 to S5 with its myotome and reflex, and the visual field explorer shows the defect a lesion causes at each point from the optic nerve to the visual cortex.
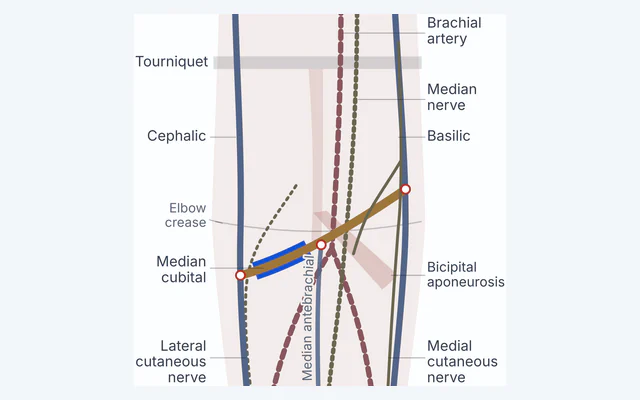
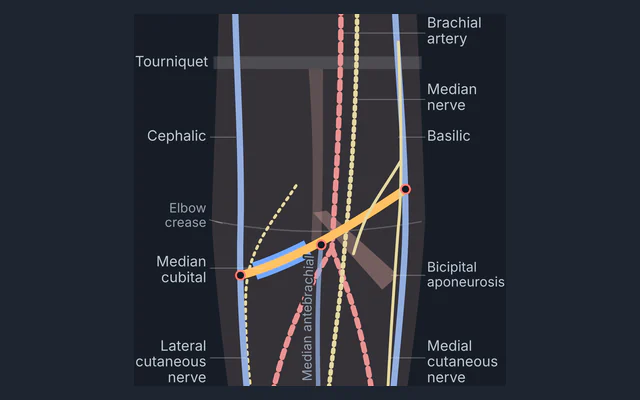
Three more are for bedside skills. The auscultation explorer places the five cardiac areas and the lung sites on the ribs, the injection sites explorer paints the deltoid, ventrogluteal and vastus lateralis sites on the muscle around their bony landmarks, and the venipuncture explorer draws the elbow veins with the artery and nerves beside each.
Practice questions and test statistics
The lab and clinical practice set generates QTc, MAP, A-a gradient, corrected calcium and osmolality questions, marks each answer when you press Check and shows the working, with every answer computed by the calculator it came from.
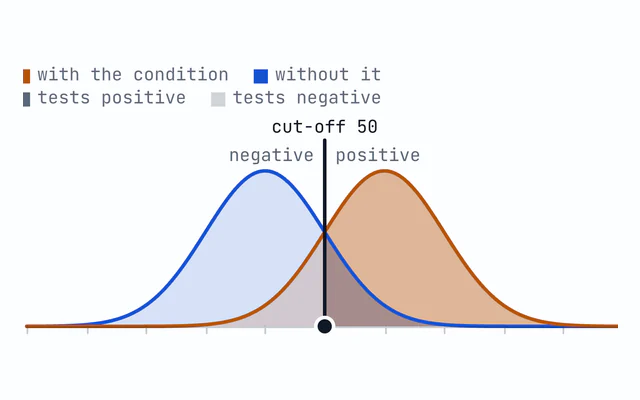
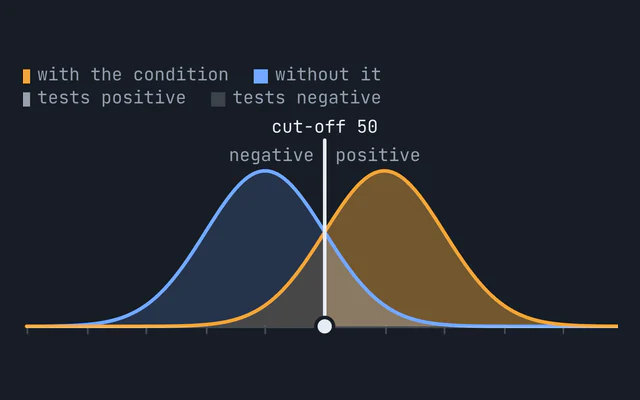
The sensitivity and specificity tool covers the other half of reading a result: how moving a test’s cut-off trades one against the other, and how prevalence sets the positive predictive value.
Two more sets ask nursing calculations the same way: the dosage set covers drip rates, pump rates, weight-based infusions and mg/kg doses, and the IV drip rate set the infusion rates alone.
Updated First published