Menstrual Cycle Hormone Simulator
Play the menstrual cycle day by day: FSH, LH, estrogen and progesterone, with the follicle and lining redrawn, plus pill and anovulatory modes.
Simulator
Drag across the lanes, or use the left and right arrow keys, to move through the cycle in 6-hour steps. Home returns to day 1. Space plays and pauses.
A 28-day ovulatory cycle with a luteal phase of 14 days. Bleeding lasts the first 4 days. Estradiol climbs as one follicle is selected and grows, and peaks at 288 pg/mL at Day 13, 22:00, when the LH surge begins. LH peaks at 51.5 IU/L at Day 14, 12:00, and ovulation follows at Day 15, 04:30. Progesterone from the corpus luteum peaks at 13.3 ng/mL, 7.0 days after the LH peak, and falls before the next period, which starts on day 29.
- Cycle day Day 1 is the first day of bleeding.
- Day 1 00:00
- Phase
- Menstruation
- LH
- 3.39 IU/L
- FSH
- 4.95 IU/L
- Estradiol 1 pg/mL of estradiol is 3.671 pmol/L, from its molar mass of 272.4 g/mol.
- 39.2 pg/mL
- Progesterone 1 ng/mL of progesterone is 3.180 nmol/L, from its molar mass of 314.5 g/mol.
- 0.799 ng/mL
- Leading follicle A wave emerges at 5 mm, one follicle is selected at 10 mm and the ovulatory follicle grows 1.42 mm a day (Baerwald and colleagues).
- 5.0 mm
- Lining Both layers together, as ultrasound measures it, from the stated growth rule.
- 10.5 mm, shedding
- LH peak
- Day 14, 12:00
- Ovulation 16.5 h after the LH peak, the WHO Task Force’s (1980) median.
- Day 15, 04:30
- Mid-luteal test Where NICE NG257 times the progesterone test: day 21 of a 28-day cycle, day 28 of a 35-day one.
- Day 21
- Next period Day 29 of this cycle is day 1 of the next.
- Day 29
- Feedback
- Negative from estradiol
- LH pulse every Filicori and colleagues (1986): 94 min early follicular, 71 late follicular, 103 early luteal, 216 late luteal, joined by straight lines.
- 155 min
A demonstration of a typical cycle, not a diagnosis. Do not use it to time conception, to avoid pregnancy or to manage a pill.
- Leading follicle
- Lining, both layers
- Corpus luteum
Citing this tool
Last updated . Add the date you accessed it as well, which a citation of a page that can change asks for. If a specific result matters, cite the permalink from the tool’s share row instead of this page: it reproduces the exact parameters.
On the syllabus: MCAT, 3B: Structure and integrative functions of the main organ systems.
The equation
WHO Task Force (1980), Am J Obstet Gynecol 138:383
What hormones regulate the human menstrual cycle?
The menstrual cycle is governed by rhythmic endocrine feedback along the hypothalamic-pituitary-ovarian axis involving four key hormones: pituitary FSH (follicle-stimulating hormone) promoting follicular maturation; estrogen driving endometrial proliferation; a sharp LH (luteinising hormone) surge triggering ovulation; and corpus luteum progesterone maintaining the secretory endometrium.
The four hormones and the loop that times them
The cycle is run by a loop of three organs. The hypothalamus releases GnRH in pulses, and each pulse makes the pituitary gland release FSH and LH. FSH, follicle-stimulating hormone, grows a wave of follicles in the ovary; the one that outgrows the rest makes estradiol, the main estrogen. LH, luteinising hormone, then triggers ovulation and turns the emptied follicle into the corpus luteum, which makes progesterone. Estradiol, progesterone and inhibin from the ovary feed back on the hypothalamus and the pituitary, so each phase of the cycle sets up the next.
For most of the cycle that feedback is negative: estradiol and inhibin hold FSH and LH down in the follicular phase, and progesterone slows the GnRH pulses in the luteal phase. Once the dominant follicle has pushed estradiol high for long enough, the feedback on the pituitary turns positive and sets off the LH surge. In the diagram above, negative feedback is drawn grey with a minus and positive feedback amber with a plus, and the GnRH pulses tick at the interval Filicori and colleagues measured in 51 ovulatory cycles: 94 minutes early in the follicular phase, 71 late in it, 103 early in the luteal phase and 216 late in it.
How to read the graph
The lanes share one day axis, so any moment reads straight down through all four hormones, in the style of a Wiggers diagram of the heart: LH in blue and FSH in violet in IU/L, estradiol in amber and progesterone in green, in pg/mL and ng/mL or, on the units switch, in pmol/L and nmol/L. The band under them marks the bleed, the follicular phase, the surge and the luteal phase, and its small triangles are the events Next event steps through; the dashed line down every lane is ovulation. Day 1 is the first day of bleeding, and the clock runs from 00:00 on day 1. Drag across the lanes to move the cursor, or use the arrow keys, which step 6 hours.
The curves are not a simulation of anybody’s cycle. They are the daily medians of 20 women aged 20 to 36, sampled every day of one cycle by Stricker and colleagues (2006) on one laboratory’s analyser, joined smoothly between days and laid out on the cycle you choose. Each day’s median, with its 5th and 95th percentile, is tabulated in US and SI units on the menstrual cycle hormone levels by day pages. At the defaults the median for each day sits at 12:00, with the LH peak’s day on day 14, and the curve passes through every median exactly except LH and FSH on the peak’s day and the day after, which the surge replaces. The drawings follow the same clock: the ovaries and the lining are drawn to scale against their scale bars, from the model’s own numbers.
Worked example: the 36 hours around ovulation
Take the defaults, a 28-day cycle with a 14-day luteal phase, and follow the 36 hours from 22:00 on day 13 to 10:00 on day 15. At 22:00 on day 13 estradiol reaches its peak of 287.8 pg/mL (1056.4 pmol/L) and the LH surge begins from 13.9 IU/L, with the dominant follicle at 18.4 mm. Fourteen hours later, at 12:00 on day 14, LH reaches its plateau of 51.5 IU/L, FSH 15.3 IU/L, while estradiol has already fallen to 182.8 pg/mL.
The plateau holds until 02:00 on day 15. At 04:30 the follicle ruptures at 20.2 mm and the egg leaves for the uterine tube: ovulation, 16.5 hours after the LH peak and 30.5 hours after the surge began. LH is falling with a half-time of 9.6 hours, through 43.0 IU/L at ovulation to 28.9 IU/L by 10:00, and progesterone has climbed from 0.51 ng/mL at the surge’s onset to 1.49 ng/mL as the corpus luteum takes shape.
Why the surge rises above the day-0 median
A daily sample cannot draw a surge that lasts two days. Some women’s surges had begun before their day −1 sample and others were already over by their day +1 sample, so the medians smear the surge across three days: 12.36, 41.19 and 14.92 IU/L. So around the peak the model follows the shape Hoff, Quigley and Yen measured every 2 hours in five women: 14 hours rising, 14 at the peak and 20 falling. Its height is set so that LH averaged over the peak’s whole day is the day-0 median of 41.19 IU/L, which puts the plateau at 51.5 IU/L. The rise then doubles LH every 7.4 hours rather than Hoff’s 5.2, because it starts from the day −1 median carried on at the 59-hour doubling time, the middle of the 57 to 61 hours Hoff measured before the surge. FSH is treated the same way, peaking at 15.3 IU/L for a day-0 median of 12.82.
The follicle, the corpus luteum and the lining
Each ovary is drawn 35 mm long with a 1 cm bar. A wave of follicles emerges when its largest reaches 5 mm, the middle of the 4 to 6 mm Baerwald, Adams and Pierson give, and one is selected at 10 mm and outgrows the rest. Baerwald, Walker and Pierson measured that follicle growing 1.42 mm a day for 7.16 days from selection to ovulation, which is how it reaches 20.2 mm, inside the 16 to 29 mm range of pre-ovulatory follicles. At the defaults it is selected at 00:40 on day 8. Afterwards the corpus luteum grows from the ruptured follicle to the 411.6 mm² measured four days after ovulation, a circle 22.9 mm across, then fades, and it is still there at 18:54 on day 6 of the next cycle, 19.6 days after ovulation. The drawing alternates the ovary each cycle, so the old one fades in one ovary while the new follicle grows in the other.
The lining is drawn as ultrasound measures it, both layers across the cavity. Nalaboff, Pellerito and Ben-Levi give 1 to 4 mm during menstruation, 5 to 7 mm in the proliferative phase, up to 11 mm around ovulation and 7 to 16 mm in the secretory phase, thickest in the middle of it. The model grows it by a stated rule, faster as estradiol rises, stopped by progesterone and swelling with progesterone’s secretory effect, and at the defaults it measures 2.6 mm when the bleed ends, 5.9 mm at noon on day 10, 9.7 mm at ovulation and 11.2 mm at the progesterone peak, before it is shed. Its glands are drawn straight while it proliferates and coiled once it turns secretory.
Day 14 is a textbook convenience
Ovulation on day 14 assumes a 28-day cycle and a 14-day luteal phase, and in this model those put the LH peak at 12:00 on day 14 and ovulation at 04:30 on day 15. Real cycles vary. Of 612,613 ovulatory cycles tracked with an app by Bull and colleagues (2019), only 13 percent were 28 days long; the mean cycle was 29.3 days, the mean follicular phase 16.9 days, with the paper’s 95 percent range 10 to 30, and the mean luteal phase 12.4 days, range 7 to 17. FIGO counts 24 to 38 days as a normal cycle length.
Most of that variation is in the follicular phase, so the cycle length slider here moves only the follicular phase: the LH peak falls on the cycle length minus the luteal phase, and everything from it to the next period keeps its timing. A 35-day cycle puts the LH peak at 12:00 on day 21 and ovulation at 04:30 on day 22; a 21-day one puts them on days 7 and 8. The fertile window, the 6 days ending on the day of ovulation (Wilcox, Weinberg and Baird, 1995), moves with it: days 10 to 15 at the defaults, but days 17 to 22 in a 35-day cycle. Wilcox, Dunson and Baird (2000) found the window falls entirely within days 10 to 17 in only about 30 percent of women.
The day 21 progesterone test
Progesterone confirms that ovulation happened, because only a corpus luteum makes it in quantity, and the test is timed for the middle of the luteal phase, a week before the cycle ends. NICE’s guideline NG257 (2026) puts it at day 21 of a 28-day cycle and, for a longer cycle, gives day 28 of a 35-day one; the green dashed line marks that day. At the defaults it is also the day the median peaks, at 13.35 ng/mL (42.45 nmol/L) at 12:00 on day 21. The corpus luteum then regresses: progesterone falls through half its peak at 03:08 on day 25, and the bleed follows. Every day’s figures, with the 5th to 95th percentile, are on the progesterone levels by cycle day page.
Basal body temperature
Progesterone raises the resting temperature, which is why charts of it rise after ovulation. The optional lane draws that rise by a stated rule, 0.35 °C × P / (P + 2 ng/mL), chosen to give the 0.2 to 0.3 °C rise Bull and colleagues describe. At the defaults the rise is 0.26 °C two days after ovulation and 0.30 °C at the progesterone peak, against 0.02 °C at its lowest in the follicular phase, so it climbs 0.24 °C within those two days. The rise comes after ovulation, so it cannot predict it, and NICE advises against using temperature charts even to confirm it.
On the combined pill
Pill mode draws a pack of 28 days: 21 active tablets and 7 hormone-free days, 24 and 4, or continuous use, at 30 or 20 µg of ethinylestradiol. Each tablet adds one oral dose’s curve, the same one the pharmacokinetics simulator uses for repeated doses, with the half-lives on the FDA label of a levonorgestrel and ethinylestradiol pill, 36 hours for levonorgestrel and 18 for ethinylestradiol, and a peak 1.5 hours after each tablet. The hatched lane shows the two levels against the 30 µg pill’s steady-state peak.
While the levels are high, FSH and LH are held down, here to about 3.6 and 1.5 IU/L on day 14 of a 30 µg pack, and there is no surge, no ovulation and no corpus luteum. Real suppression is often deeper: van Heusden, Coelingh Bennink and Fauser (2002) found both below 1 IU/L at the start of the pill-free week in 67 percent of 36 women on low-dose pills. In the 7-day break the pill washes out and FSH climbs, here to 7.0 IU/L by the end of the break on 30 µg, the median van Heusden and Fauser (1999) measured. On 20 µg the suppression is weaker: the follicle is already 7.4 mm when the break begins against 5.3 mm on 30 µg, it grows to 9.9 mm by the end, and its estradiol and inhibin pull FSH back down to 4.8 IU/L, between the 4.9 and 4.5 IU/L they measured on two 20 µg pills. That is why the 7-day break ends with FSH lower on the weaker pill.
Van Heusden and Fauser found that the estrogen dose, not the progestogen, decided how far the ovary recovered, and two of their three pills paired the same 150 µg of desogestrel with 30 or 20 µg, so the progestogen is drawn at one dose for both strengths. They sampled only the 7-day break, so the 4-day break of the 24 and 4 pack is not calibrated: here it ends before the follicle has grown enough to pull FSH back down, at 5.9 IU/L on 30 µg and 6.2 on 20 µg.
The bleed in the break is a withdrawal bleed, the lining shed as the pill’s hormones fall, not a period: drawn here from 08:00 on day 23, inside the label’s “within 3 days” of the last active tablet. On continuous use there is no scheduled bleed. This mode is a calibrated sketch of physiology, matched to those end-of-break medians, and it gives no advice on taking a pill.
Anovulatory cycles
In an anovulatory cycle a follicle grows but no LH surge comes, so there is no ovulation, no corpus luteum and no rise in progesterone. Bleeding comes when estradiol falls, and cycles like this are common soon after periods start and before they stop. The anovulatory mode is an illustrative pattern, not reference data: it replays the ovulatory follicular phase up to a 13 mm follicle, holds it while the follicle stalls, and runs it backwards as the follicle regresses over four days. Estradiol levels off at 87.7 pg/mL, LH never passes 4.96 IU/L, and without progesterone to stop it the lining keeps growing, to 13.0 mm in a 28-day cycle.
The egg and meiosis
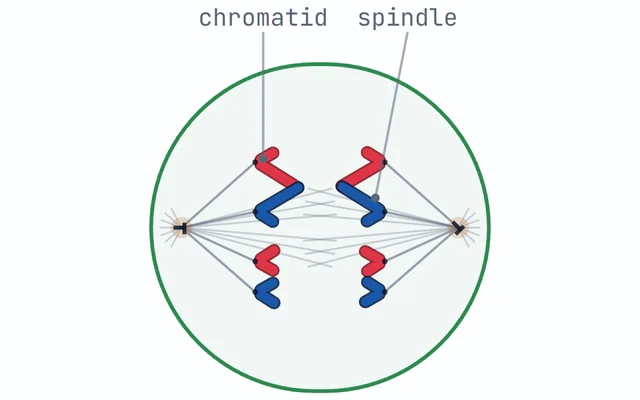
The egg has been paused in the first division of meiosis since before birth. The LH surge restarts it, the egg completes meiosis I just before ovulation and is released paused again, partway through meiosis II, which it finishes only if fertilised. The mitosis and meiosis explorer steps through both divisions.
What the model leaves out
- Inhibin, AMH and prolactin. Inhibin B helps lower FSH as the follicle grows and inhibin A rises in the luteal phase, but neither is drawn; nor is AMH, nor prolactin.
- Day-to-day noise. Every curve is a median, so no single cycle looks this smooth, and the medians at the ends of the cycle come from fewer women: 14 or 15 on its first day and 8 or 9 on its last, where most days have all 20.
- One assay. The values are one analyser’s, in one laboratory, from 20 women, and reference ranges differ between laboratories.
- The warp. Other cycle lengths are the same medians stretched or compressed, not data from women with those cycles. Stretched, they give the lining longer to grow: in a 38-day cycle it is 12.2 mm at ovulation, past the 11 mm Nalaboff and colleagues give.
- Two sketches. The anovulatory and pill modes are patterns built to show a mechanism, matched to data only where this page says so.
Like the cardiac cycle simulator, the animation is a cursor moving through one solved period, so every lane, drawing and readout reads the same numbers.
Common mistakes
- Assuming ovulation is on day 14. It follows the LH peak by about 16.5 hours, wherever the peak falls, and only 13 percent of tracked cycles were 28 days long.
- Calling the bleed on the pill a period. It is a withdrawal bleed: the pill has prevented ovulation, so there was no corpus luteum to fail.
- Drawing estradiol peaking with LH. Estradiol peaks first, at the surge’s onset, and is already falling when LH reaches its peak 14 hours later.
- Thinking progesterone comes from the follicle. It comes in quantity from the corpus luteum, so it rises after ovulation and is the hormone a test uses to confirm it.
- Using a temperature chart to predict ovulation. The rise follows ovulation, so at best it shows that ovulation has already happened, never that it is coming.
Sources
Stricker R and colleagues, Clin Chem Lab Med 2006;44:883-887, for the daily medians. Hoff JD, Quigley ME and Yen SSC, J Clin Endocrinol Metab 1983;57:792-796, for the surge. The WHO Task Force, Am J Obstet Gynecol 1980;138:383-390, for ovulation. Filicori M and colleagues, J Clin Endocrinol Metab 1986;62:1136-1144, for the pulses. Bull JR and colleagues, npj Digit Med 2019;2:83, for cycle lengths. Baerwald AR and colleagues, Hum Reprod Update 2012;18:73-91, Fertil Steril 2009;91:440-449 and Ultrasound Obstet Gynecol 2005;25:498-507, for the follicle and the corpus luteum. Nalaboff KM and colleagues, RadioGraphics 2001;21:1409-1424, for the lining. Wilcox AJ and colleagues, N Engl J Med 1995;333:1517-1521 and BMJ 2000;321:1259-1262, for the fertile window. Van Heusden AM and Fauser BCJM, Contraception 1999;59:237-243, for the pill-free interval, and van Heusden AM, Coelingh Bennink HJ and Fauser BCJM, Clin Endocrinol 2002;56:509-517, for the levels on active tablets. Munro MG and colleagues, Int J Gynaecol Obstet 2018;143:393-408, for FIGO’s normal range. NICE guideline NG257 (2026). The FDA labels for Aviane and Amethyst on DailyMed. The drawings are this site’s own.
Model and assumptions
- Method
- Exact expression, no time stepping
- Repeatability
- Deterministic. The same link gives the same numbers on any machine.
What it assumes
- The ovulatory hormones are the daily medians Stricker and colleagues (2006) measured in 20 women on one laboratory’s analyser, joined by Fritsch and Carlson’s monotone cubic in the logarithm for LH, FSH and estradiol and by straight lines for progesterone, so no curve overshoots and every median is met exactly, except LH and FSH on the LH peak’s day and the day after.
- From the surge’s onset to its end, LH and FSH follow the three limbs Hoff, Quigley and Yen (1983) measured every 2 hours, 14 hours rising, 14 on a plateau and 20 falling, with LH falling at their 9.6-hour half-time and each plateau set so that the mean over the LH peak’s day equals that day’s median.
- Estradiol peaks at the surge’s onset, 14 hours before the LH peak, and ovulation comes 16.5 hours after the LH peak, the WHO Task Force’s (1980) median, which at the defaults puts it at 04:30 on day 15.
- The LH peak falls at 12:00 on the cycle length minus the luteal length; the five days before it and the day after keep their real spacing, while the earlier follicular days and the later luteal days are stretched or compressed to fit, so another cycle length shows the same medians warped, not data from women with that cycle.
- The dominant follicle grows 1.42 mm a day from 5 mm, is selected at 10 mm 7.16 days before ovulation and ruptures at 20.2 mm (Baerwald, Walker and Pierson, 2009), and the corpus luteum grows to 411.6 mm² four days after ovulation and is gone 19.6 days after it (Baerwald, Adams and Pierson, 2005).
- The lining is a calibrated rule rather than data: after the bleed it grows at up to 1.9 mm a day as estradiol rises, slows towards 16 mm, is stopped by progesterone and swells with progesterone’s secretory effect, with constants chosen to pass through the range Nalaboff, Pellerito and Ben-Levi (2001) give for each phase.
- Basal body temperature rises by 0.35 °C × P / (P + 2 ng/mL), a rule calibrated to the 0.2 to 0.3 °C rise Bull and colleagues (2019) describe rather than a measured law.
- The anovulatory mode is an illustrative pattern: the ovulatory follicular phase replayed up to a 13 mm follicle, held while the follicle stalls and run backwards as it regresses over four days, with progesterone held at its follicular median.
- The pill mode is a calibrated sketch: each tablet adds one oral dose’s curve from the pharmacokinetics model with the half-lives on a levonorgestrel and ethinylestradiol label, a pituitary that remembers those levels over 96 hours holds FSH and LH down, and a follicle grows while the drive clears a threshold, with constants fitted only to van Heusden and Fauser’s (1999) FSH medians at the end of the 7-day break, so the 4-day break is uncalibrated and FSH and LH on active tablets sit above the 1 IU/L that 67 percent of women on low-dose pills were below in van Heusden, Coelingh Bennink and Fauser’s (2002) study.
Where it stops holding. Any one woman’s cycle, whose hormones vary from day to day, from cycle to cycle and between laboratories; cycles changed by polycystic ovary syndrome, pregnancy, breastfeeding or the menopause transition; and the pill’s hormones as concentrations in the blood, which this tool draws only as a share of a reference peak. The Pharmacokinetics Dosing Simulator is the right tool there.
Numerical accuracy
The ovulatory and anovulatory hormones, the follicle, the corpus luteum and the temperature rise are closed forms in the time, exact to rounding, and the one number found by search is the height of each surge’s plateau, found by halving a bracket until it is settled to the limit of double precision. The lining is a sum rather than a closed form: its growth rate is summed by the trapezoidal rule over hourly values from the end of the bleed, and only the sum is approximate, since it then goes through the cap’s exact solution; against the same sum on a grid eight times finer it differs by at most 0.11 µm at any cycle and luteal length. The pill sketch is stepped, on an internal grid of 7.5 minutes: over each step the pituitary’s memory is solved exactly with the pill levels running straight across it, and the follicle with the drive held at its mean, and the run stays within 1.4 µm in the follicle and 0.0012 IU/L in FSH of a grid eight times finer. Between the hours, the lining and the pill mode’s readings are taken straight between hourly values, which moves the lining by at most 9 µm and the pill mode’s FSH by at most 0.007 IU/L, and the lanes are drawn as straight pieces joining those values.
Common questions
Which hormones control the menstrual cycle?
Four hormones do most of the work, timed by a loop of three organs. The hypothalamus releases GnRH in pulses, which make the pituitary gland release FSH and LH; FSH grows a wave of follicles in the ovary, and the one that outgrows the rest makes estradiol, the main estrogen. LH then triggers ovulation and turns the emptied follicle into the corpus luteum, which makes progesterone. Estradiol, progesterone and inhibin from the ovary feed back on the hypothalamus and the pituitary, so each phase of the cycle sets up the next.
What triggers the LH surge?
Estradiol from the dominant follicle. For most of the cycle estradiol holds LH down, but once it has stayed high for long enough its feedback on the pituitary turns from negative to positive, and LH surges. Hoff, Quigley and Yen (1983), sampling every 2 hours, found that the surge lasts about 48 hours: 14 rising, 14 at its peak and 20 falling. It begins as estradiol peaks, here at 287.8 pg/mL at 22:00 on day 13 of a 28-day cycle, so estradiol is already falling when LH reaches its peak.
When does ovulation happen in the menstrual cycle?
A median 16.5 hours after the LH peak, by the WHO Task Force’s 1980 analysis of 107 women. The textbook day 14 assumes a 28-day cycle with a 14-day luteal phase, which is what this simulator draws by default: it puts the LH peak at 12:00 on day 14 and ovulation at 04:30 on day 15. In 612,613 cycles tracked with an app, only 13 percent were 28 days long, and the luteal phase averaged 12.4 days (Bull and colleagues, 2019). Most of the variation is in the follicular phase, so ovulation moves with the cycle length.
Why does progesterone rise after ovulation?
Because the emptied follicle becomes the corpus luteum, which makes progesterone in quantity, along with estradiol. Progesterone climbs for about a week, peaking at 13.35 ng/mL on day 21 at the defaults, and falls as the corpus luteum regresses; it passes half its peak at 03:08 on day 25. Once it has fallen, the lining is no longer maintained and is shed as the next period. Only a corpus luteum makes this much progesterone, which is why a mid-luteal test can confirm that ovulation happened.
How does the combined pill stop ovulation?
Its ethinylestradiol and progestogen hold FSH and LH down, so while the tablets are taken follicles stay small and there is no LH surge, and without a surge there is no ovulation. In the hormone-free week the pill’s hormones wash out and FSH rises: van Heusden and Fauser (1999) measured FSH at 7.0 IU/L by the end of the week on a 30 µg pill and follicles of 10 mm or more in 18 to 27 percent of women on 20 µg pills, with no ovulations. The bleed in that week is a withdrawal bleed, not a period. This is physiology only, not contraceptive advice.
What is an anovulatory cycle?
A cycle in which a follicle grows but no LH surge comes, so there is no ovulation, no corpus luteum and no rise in progesterone. Bleeding comes when estradiol falls and can be irregular, and cycles like this are common soon after periods start and before they stop. The simulator’s anovulatory mode is an illustrative pattern rather than reference data: its LH never passes 4.96 IU/L, and without progesterone the lining keeps growing, to 13.0 mm in a 28-day cycle.
Why is the day 21 progesterone test only on day 21 in a 28-day cycle?
Because it is timed for the middle of the luteal phase, about 7 days before the next period, when the corpus luteum makes the most progesterone. NICE’s fertility guideline, NG257 (2026), puts it at day 21 of a 28-day cycle and gives day 28 of a 35-day cycle as the example for a longer one. Most of the difference between cycles is in the follicular phase, so in a long cycle a fixed day 21 can come before ovulation, while progesterone is still low. The simulator marks the test day with a green dashed line that moves with the cycle length.