Caffeine Level Simulator
Add coffee, tea, cola or energy drinks at any time and see the caffeine in your body hour by hour, set by your half-life, with what is left at bedtime.
Simulator
Drag the cursor, a drink, or the moon and sun. Tap a drink to change it. Arrow keys move the cursor and B jumps to bedtime. Space plays and pauses.
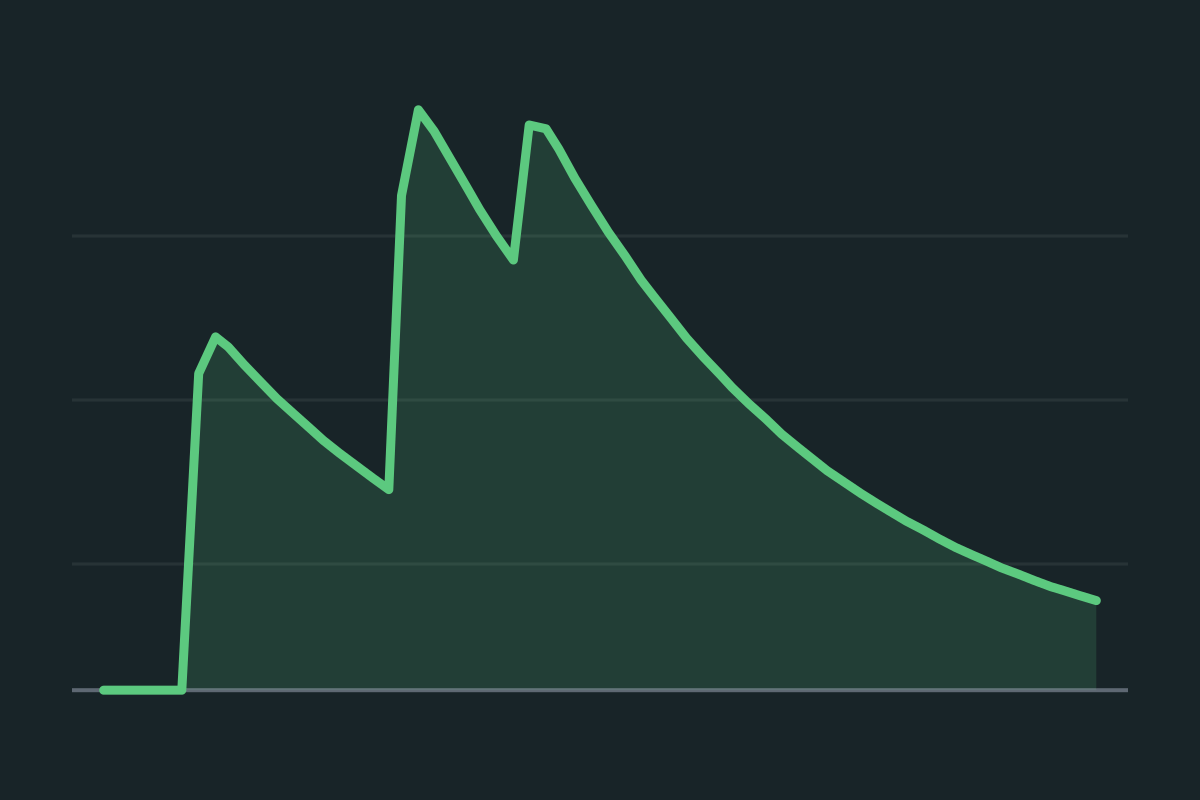
Caffeine in your body from 06:00 to 06:00 the next morning, at a half-life of 5 h: espresso, 80 mg, at 08:00; filter coffee, 90 mg, at 13:00; cola, 40 mg, at 16:00. It peaks at 120.1 mg at 13:34. At bedtime, 23:00, 48.8 mg is left. It is below 50 mg from 22:50 and below 25 mg from 03:50.
At bedtime, 23:00, 48.8 mg of caffeine is still in your body, from 210 mg taken by then.
- At bedtime What is left in your body at 23:00 of the 210 mg taken by then, about 0.6 of an espresso: each drink absorbed within the hour, then halving every 5 h. EFSA says single doses of 100 mg “may affect sleep duration and patterns in some adults, particularly when consumed close to bedtime”. That is a dose, not an amount in the body, so it is drawn on the plot only as a scale.
- 48.8 mg at 23:00
- Peak The most caffeine in your body all day: the moment the caffeine still arriving from the gut falls behind what the liver clears. At this half-life a single drink peaks about 38 minutes after it.
- 120.1 mg at 13:34
- Below 50 mg from The first whole minute from which the amount stays below 50 mg until 06:00, found by searching the falling curve. 50 and 25 mg are a half and a quarter of the 100 mg single dose that EFSA says may affect sleep, marks to read the fall against rather than safe levels.
- 22:50
- Below 25 mg from The same for 25 mg. Once every drink is absorbed the amount halves every half-life, so this comes about one half-life after the fall below 50 mg.
- 03:50
- Taken today EFSA: intakes up to 400 mg a day “consumed throughout the day do not raise safety concerns for healthy adults in the general population, except pregnant women”. The FDA cites 400 milligrams a day for most adults “as an amount not generally associated with negative effects”. Neither is a limit set for you.
- 210 mg of 400
- Left next morning Still in your body the next morning, the moment the first drink of the same day again would go down. A routine repeated every day adds it to the next day’s caffeine, and the three-day plot shows where that settles.
- 14.0 mg at 08:00
Gardiner et al. (2023): at least 8.8 h before bed for a 107 mg coffee, to avoid losing sleep time.
A demonstration on an average body, not a measurement or a diagnosis. Half-lives differ several-fold between people, so this cannot say what amount is safe for you.
- Your half-life, 5 h
- Fast, 3 h
- Slow, 7 h
- At bedtime
- At the next day’s first drink
Repeated every day, 14.5 mg is left at each morning’s first drink by day 3 and the bedtime amount settles at 50.6 mg, against 48.8 mg on day 1.
Citing this tool
Last updated . Add the date you accessed it as well, which a citation of a page that can change asks for. If a specific result matters, cite the permalink from the tool’s share row instead of this page: it reproduces the exact parameters.
The equation
Bateman (1910), one-compartment oral absorption
What the caffeine curve shows
The curve is the caffeine in your body through a day, from 06:00 to 06:00 the next morning, worked out from the drinks you put on the timeline and your half-life. Each drink adds a hump. Caffeine is absorbed from the gut quickly: the Institute of Medicine’s 2001 review describes it as rapidly and completely absorbed, “with 99 percent being absorbed within 45 minutes of ingestion”. From then on the liver clears a fixed share of whatever is left each hour, so the amount halves every half-life. With a 5 hour half-life a single drink peaks 38 minutes after it, with 91.6 percent of its caffeine in the body, because some is already being cleared while the rest is still arriving.
After that it halves every 5 hours. A 100 mg drink leaves 25.6 mg after 10 hours, 12.8 mg after 15,
6.39 mg after 20 and 3.20 mg after 25, a little more than the 25, 12.5, 6.25 and 3.13 mg an
instant dose would leave, because absorption starts the clock slightly late. Each coloured layer
under the curve is one drink’s own curve, stacked on the ones before it, and the dark line on top
is their sum:
A(t) = Σ Dᵢ (ka / (ka − k)) (e^(−k(t − tᵢ)) − e^(−ka(t − tᵢ))), where Dᵢ is the
caffeine in the drink taken at tᵢ, k = ln 2 / t½ is the rate the body clears it and ka is the rate
it is absorbed. Adding the drinks up like this is exact because the clearance is proportional to
the amount: double every dose and every point on the curve doubles, whatever else is in you. The
body view below the curve shows the same caffeine as dots, about one for every 2 mg, moving from the
gut into the circulation and leaving it at the liver.
The absorption rate is set so that 99 percent of a drink is absorbed in 45 minutes,
ka = ln 100 / 0.75 h = 6.14 per hour. All of the caffeine reaches the body: Blanchard
and Sawers (1983) measured an absolute bioavailability of 108.3 ± 3.6 percent after an oral dose,
essentially complete, and the Institute of Medicine reports no first-pass loss in the liver.
Using the simulator
Tap a drink under the timeline to add it at the cursor’s time, or with a mouse drag it onto the day. Drag a drink along the axis to move it in quarter hours, or tap it to change its caffeine or its time. With a keyboard, each drink is a button that its arrow keys move and Delete removes. Drag the moon and the sun to set bedtime and waking, and drag along the day, or press Play, to move the cursor. Set your half-life with the slider, the Average, Fast and Slow buttons or one of the things that change it, and switch between EFSA’s servings and the FDA’s.
The readouts give the amount at bedtime, the peak, when the amount falls below 50 and 25 mg, the day’s total against EFSA’s 400 mg a day and what is still there the next morning, and the bar under them sets the hours from your last caffeine to bed against Gardiner’s 8.8. The plot below the stage repeats the day three times, with the same drinks at a fast 3 hour and a slow 7 hour half-life dashed either side, so you can see what each morning carries over. The address bar holds the whole day, so a copied link opens the same drinks, times and settings.
Worked example: 48.8 mg still in you at 23:00
The simulator opens on an ordinary day in EFSA’s servings: an espresso of 80 mg at 08:00, a filter coffee of 90 mg at 13:00 and a can of cola of 40 mg at 16:00, with bed at 23:00 and a half-life of 5 hours.
- At bedtime. The espresso has had 15 hours, three half-lives, and leaves 10.23 mg.
The coffee has had 10 hours and leaves 23.02 mg, and the cola, 7 hours old, 15.51 mg. Together that
is
10.23 + 23.02 + 15.51 = 48.76 mg, which the readout shows as 48.8 mg, about 0.6 of an espresso, from 210 mg drunk. - The peak. 120.1 mg at 13:34, 34 minutes after the coffee, when 37.8 mg of the espresso is still there and 82.3 mg of the coffee is in the body.
- The fall. The amount is 56.0 mg at 22:00 and 42.4 mg at midnight. It drops below 50 mg from 22:50 and below 25 mg from 03:50, exactly 5 hours later, because once every drink is absorbed the whole sum halves every half-life.
- The next morning. 14.0 mg is left at 08:00, when the next day’s espresso would go down.
- Day after day. Repeat the same day and caffeine barely builds up. 24 hours is 4.8
half-lives, and
2^(−4.8) = 0.036, so each day carries only about 3.6 percent of the last: by day 3 the morning’s first drink finds 14.5 mg and the bedtime amount settles at 50.6 mg.
The 210 mg taken is about half of the 400 mg a day EFSA describes for healthy adults, and the last caffeine is 7 hours before bed, short of the 8.8 hours Gardiner and colleagues found a cup of coffee needs, which is the next section.
How late is too late for sleep?
Three sources frame the answer, each from a different direction. Gardiner and colleagues (2023) pooled 24 studies and found that “Caffeine consumption reduced total sleep time by 45 min and sleep efficiency by 7%”. To avoid the loss of sleep time, they concluded, “coffee (107 mg per 250 mL) should be consumed at least 8.8 h prior to bedtime and a standard serve of pre-workout supplement (217.5 mg) should be consumed at least 13.2 h prior to bedtime”. Drake and colleagues (2013) gave 400 mg at bedtime and 3 and 6 hours before it, and found that “caffeine taken 6 hours before bedtime has important disruptive effects on sleep”. EFSA, for a single dose: “Single doses of 100mg (about 1.4mg/kg bw) of caffeine may affect sleep duration and patterns in some adults, particularly when consumed close to bedtime.”
What the simulator adds is what those rules leave in you. Gardiner’s 107 mg coffee, drunk 8.8 hours before bed, still leaves 32.3 mg at bedtime with a 5 hour half-life, 14.6 mg with a 3 hour one and 45.5 mg with a 7 hour one. The dashed line at 100 mg on the plot is EFSA’s figure for a dose, drawn as a scale to read the curve against, and the plot labels it so: a dose and an amount in the body are different things. None of these sources gives an amount in the body at bedtime that is safe for sleep, and the simulator does not invent one. The bar under the readouts compares the hours from your last caffeine to bedtime with Gardiner’s 8.8.
Why your half-life is not the average
The Institute of Medicine gives the mean half-life of caffeine in healthy adults as “about 5 hours”, but adds that it “may range between 1.5 and 9.5 hours”. EFSA puts the average at “approximately four hours, with a range of two to eight hours”, and Temple and colleagues (2017) give 3 to 7 hours in adults. The simulator opens at 5 hours, and its Fast and Slow buttons set 3 and 7. The spread comes mostly from the liver, where one enzyme, CYP1A2, carries out the first step that the Institute of Medicine says accounts for “approximately 75-80 percent of caffeine metabolism”. Your genes help set how much of it you make, and several things change it further.
- Smoking speeds it up. “Cigarette smoking doubles the rate of caffeine clearance”, as Temple and colleagues put it, so the Smoking setting halves your half-life. The opening day then leaves 13.2 mg at bedtime instead of 48.8 mg.
- The contraceptive pill slows it: “oral contraceptive use can double caffeine half-life”, says the Institute of Medicine. At 10 hours the same drinks leave 99.0 mg at bedtime.
- Pregnancy slows it most. Clearance “slows to one-half and then to about one-third during the second and third trimesters”, James (2021) writes, and the half-life reaches “about 18 hours by the 38th week”. The third trimester setting triples your half-life: 15 hours, and 126.6 mg left at bedtime.
- Liver disease and some medicines, such as the antidepressant fluvoxamine, slow it further, as Grzegorzewski and colleagues (2022) found pooling caffeine data from 141 publications.
So the same three drinks leave anything from 13.2 mg to 126.6 mg at bedtime, depending on whose body they are in. That is the reason this page treats every number as a demonstration on an average body and never as a measurement of yours.
Sources differ on caffeine in pregnancy. EFSA found that intakes up to 200 mg a day from all sources “do not raise safety concerns for the foetus”, while the review by James (2021) quoted above concluded that “the cumulative scientific evidence supports pregnant women and women contemplating pregnancy being advised to avoid caffeine”. If you are pregnant, the FDA recommends “talking to your health care provider about whether you need to limit caffeine consumption”.
Where the servings come from
The EU servings are EFSA’s 2015 figures, which it gives as approximate “as caffeine content and portion sizes vary within and between countries”: about 80 mg in a 60 mL espresso, 90 mg in a 200 mL cup of filter coffee, 50 mg in a 220 mL cup of black tea, 40 mg in a 355 mL can of cola, 80 mg in a 250 mL can of energy drink, 25 mg in a 50 g bar of plain chocolate and 10 mg in a 50 g bar of milk chocolate. The US servings are the FDA’s, per 12 fluid ounces: 113 to 247 mg for regular brewed coffee, 71 mg for black tea, 37 mg for green tea, 23 to 83 mg for a caffeinated soft drink and 41 to 246 mg for an energy drink, and decaf “typically has 2 to 15 milligrams in an 8-fluid-ounce cup”.
Where the FDA gives a range, a drink has to start somewhere, so brewed coffee starts at 150 mg, soft drinks at 40 mg, energy drinks at 80 mg and decaf at 8 mg, each inside the FDA’s range and each this site’s choice rather than the FDA’s. Switch to US servings and the opening day takes 270 mg, with the coffee at 150 mg, and leaves 64.1 mg at bedtime. Tap any drink on the timeline to set its caffeine to the figure on your own can or cup, or to move it.
How this differs from the pharmacokinetics simulator
The Pharmacokinetics Dosing Simulator is for clinical regimens: one drug at a fixed dose every fixed interval, a therapeutic window in mg/L, the approach to steady state and the loading dose that skips it. This simulator is for everyday drinks: any number of them, of different sizes, at any times, with the amount in milligrams and the night it runs into. Both use the same one-compartment model, and this one calls the pharmacokinetics simulator’s own code for each drink’s curve, so one dose by mouth at the same half-life and absorption rate rises and falls the same way in both.
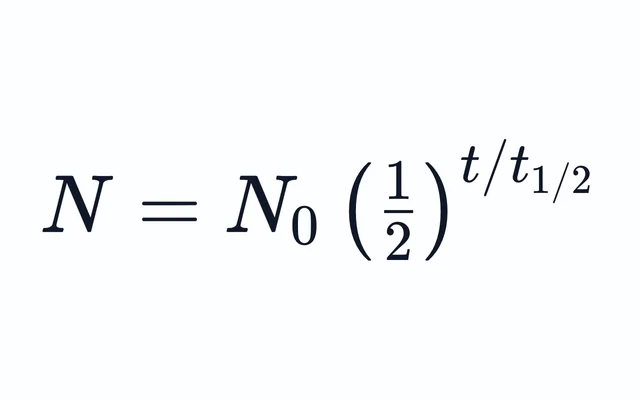
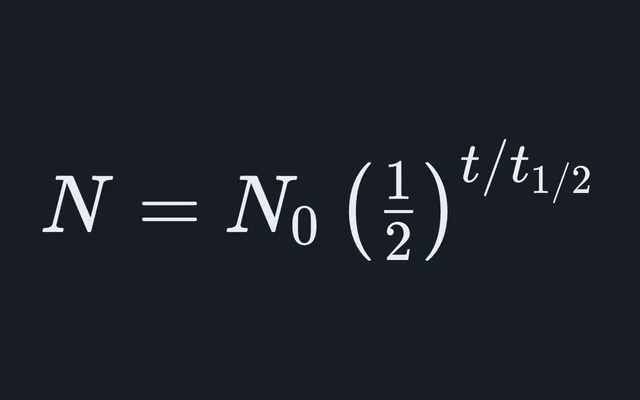
The halving once a drink is absorbed is the same first-order decay the half-life calculator works out, and the radioactive decay simulator shows nucleus by nucleus. The connection runs deeper than an analogy: the formula for a drink absorbed and then cleared is the one Harry Bateman derived in 1910 for a radioactive parent decaying into a daughter that decays in turn. Caffeine is cleared by the liver, which the internal organs explorer shows in three dimensions.
What this model leaves out
- Your own body. Every setting is a population figure: the absorption, the distribution volume and the half-life you choose. Your real half-life could sit anywhere in the range above, and this is a demonstration, not a diagnosis or a test of it.
- Absorption that varies. Peak levels come “between 15 and 120 minutes after oral ingestion”, the Institute of Medicine says, partly with gastric emptying and the food eaten with it. The model absorbs every drink at one rate.
- What caffeine becomes. Cleared means changed by the liver, mostly into paraxanthine, which the Institute of Medicine notes “has pharmacologic activity” of its own. The model follows caffeine alone.
- Effects. The same amount wakes one person and not another, and regular drinkers grow tolerant. The model gives amounts, not how alert or how well rested you will be.
- One compartment. Caffeine spreads through the body’s water, which is why a single well-mixed compartment describes it well. The concentration readout divides the amount by caffeine’s distribution volume, which the Institute of Medicine gives as 0.7 L for each kg of body mass, so it is the plasma level of an average body, not a measurement of yours.
- Night shifts and early starts. The day runs from 06:00 to 06:00, for sleep at night. When sleep ends before 06:00 comes round again, after a night shift or with an alarm before 06:00, the drinks after waking lead up to a bedtime past the end of the day, so the readings at bedtime leave them out, and the simulator says so when that happens. On the three-day plot, every later bedtime includes them.
- Children. The model and its settings are for adults. It offers nothing for children or adolescents.
Common mistakes
- Thinking the caffeine is gone after one half-life. Half of it is still there. After three half-lives an eighth is, which at 5 hours is the espresso from breakfast at bedtime.
- Reading EFSA’s lines as amounts in the body. 100 and 200 mg are single doses. A dose of 100 mg puts at most 91.6 mg in the body at once, at a 5 hour half-life, 38 minutes later.
- Counting cups rather than milligrams. A 12 fluid ounce brewed coffee can hold 113 to 247 mg, against EFSA’s 90 mg for a 200 mL cup of filter coffee.
- Forgetting the small sources. Decaf is not caffeine free, and a 50 g bar of plain chocolate holds about 25 mg.
Model and assumptions
- Method
- Exact expression, no time stepping
- Repeatability
- Deterministic. The same link gives the same numbers on any machine.
What it assumes
- The body is one well-mixed compartment, its water, so each drink’s caffeine spreads through it as it is absorbed and there is no separate distribution phase.
- Absorption from the gut is first order at ln 100 / 0.75 h, 6.14 per hour, so 99 percent of every drink is absorbed within 45 minutes, and all of it reaches the body.
- Elimination is first order at k = ln 2 / t½, so the half-life is the same at every amount and the liver clears a fixed share of whatever is in the body each hour.
- Every drink adds its own Bateman curve, computed by the pharmacokinetics simulator’s own code, and the day is their sum, so drinks can be any size at any time and nothing is stepped.
- Smoking, the contraceptive pill and the third trimester multiply your own half-life by exactly 0.5, 2 and 3, from published averages, and change nothing else about the body.
- The concentration divides the amount by caffeine’s distribution volume, 0.7 L for each kg of body mass in the Institute of Medicine’s figure, so it is the plasma level of an average body rather than a measurement of yours.
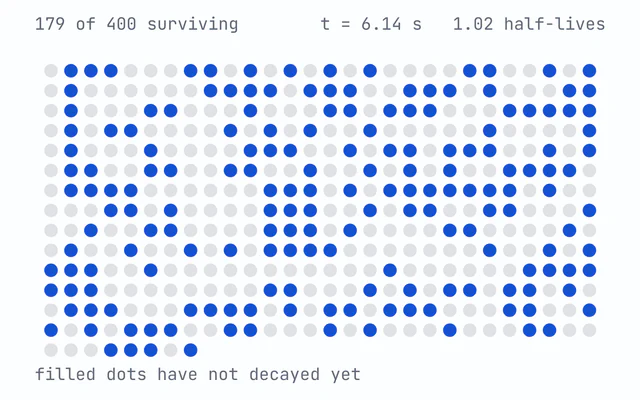
- The dots in the body view are drawn from the amounts, one for each 2 mg on an ordinary day, at fixed places, so they picture the numbers rather than producing them.
Where it stops holding. Individual bodies, whose caffeine half-life runs from under 2 hours to over 9 in healthy adults and further with liver disease, pregnancy and interacting medicines such as fluvoxamine, so every curve is an estimate for an average body and not a measurement of yours; and drugs other than caffeine given on a regular schedule, whose absorption, volume and clearance differ. The Pharmacokinetics Dosing Simulator is the right tool there.
Numerical accuracy
No time stepping, so nothing accumulates: the caffeine in the gut, in the body and cleared, at every moment, is a sum of closed forms, exact to rounding, and so is the peak, whose time between two drinks is the one moment the caffeine arriving from the gut and the caffeine the liver clears balance. Two numbers are found by search: the times the amount falls below 50 and 25 mg for the rest of the night, each found by halving a bracket on the falling part of the curve until it is settled to the limit of double precision, then shown as the first whole minute after it. The curve on the stage is drawn as straight pieces joining exact points every three minutes, with every drink’s moment among them.
Common questions
What is the half-life of caffeine?
About 5 hours on average in healthy adults, but it differs a great deal from person to person. The Institute of Medicine’s 2001 review gives the mean as “about 5 hours” and says it “may range between 1.5 and 9.5 hours”, while EFSA puts the average at “approximately four hours, with a range of two to eight hours”. It is the time your body takes to clear half the caffeine in it, so two half-lives leave a quarter and three leave an eighth. Smoking roughly halves it, the contraceptive pill can double it and the third trimester of pregnancy roughly triples it.
How long does caffeine stay in your system?
Longer than its kick, because it halves rather than running out. At a 5 hour half-life a 100 mg drink leaves 25.6 mg after 10 hours, 12.8 mg after 15, 6.39 mg after 20 and 3.20 mg after 25, so it takes about a day for almost all of it to go. A slow 7 hour half-life stretches each of those times by about 40 percent, and a fast 3 hour one shortens them by about 40 percent. The rise is quick by comparison: 99 percent of a drink is absorbed within 45 minutes, and a single drink peaks about 38 minutes after it.
How much caffeine is left at bedtime from an afternoon coffee?
About a quarter, if it was 10 hours before bed. A 90 mg filter coffee at 13:00 leaves 23.0 mg at 23:00 with a 5 hour half-life, 9.3 mg with a 3 hour half-life and 57.1 mg with a 15 hour one. Add the opening day’s 80 mg espresso at 08:00 and 40 mg cola at 16:00 and the bedtime amount is 48.8 mg, about 0.6 of an espresso. Drag the coffee along the timeline to watch that number move.
How late can I drink coffee without it affecting my sleep?
Gardiner and colleagues’ 2023 meta-analysis of 24 studies concluded that “coffee (107 mg per 250 mL) should be consumed at least 8.8 h prior to bedtime” to avoid losing sleep time, and a 217.5 mg pre-workout drink at least 13.2 h before. Drake and colleagues (2013) found that 400 mg taken 6 hours before bed still disrupted sleep. EFSA says single doses of 100 mg “may affect sleep duration and patterns in some adults, particularly when consumed close to bedtime”. Even 8.8 hours leaves 32.3 mg of that 107 mg coffee in the body at a 5 hour half-life, and 45.5 mg at a 7 hour one, so the simulator shows your own gap against Gardiner’s 8.8 hours rather than a single safe time.
Why does caffeine last longer in pregnancy or on the pill, and shorter in smokers?
Because each changes how fast the liver breaks caffeine down, mostly through the enzyme CYP1A2. “Cigarette smoking doubles the rate of caffeine clearance”, as Temple and colleagues (2017) put it, while “oral contraceptive use can double caffeine half-life”, says the Institute of Medicine, and in pregnancy clearance “slows to one-half and then to about one-third during the second and third trimesters” (James, 2021). On the opening day that moves the amount at bedtime from 48.8 mg to 13.2 mg for a smoker, 99.0 mg on the pill and 126.6 mg in the third trimester. If you are pregnant, the FDA recommends “talking to your health care provider about whether you need to limit caffeine consumption”.
How much caffeine is in coffee, tea, cola and energy drinks?
It varies widely, so any table is a starting point. EFSA’s 2015 figures are about 80 mg in a 60 mL espresso, 90 mg in a 200 mL cup of filter coffee, 50 mg in a 220 mL cup of black tea, 40 mg in a 355 mL can of cola, 80 mg in a 250 mL can of energy drink, 25 mg in a 50 g bar of plain chocolate and 10 mg in a 50 g bar of milk chocolate. The FDA gives, per 12 fluid ounces, 113 to 247 mg for regular brewed coffee, 71 mg for black tea, 37 mg for green tea, 23 to 83 mg for a caffeinated soft drink and 41 to 246 mg for an energy drink, and says decaf “typically has 2 to 15 milligrams in an 8-fluid-ounce cup”. Each of these drinks starts in the simulator at its figure here, or inside the FDA’s range where it gives one, and can be set to the one on your own can or cup.
How much caffeine a day is safe?
Nobody can say for a particular person, but EFSA and the FDA give the same daily figure for adults. EFSA concluded that intakes up to 400 mg a day “consumed throughout the day do not raise safety concerns for healthy adults in the general population, except pregnant women”, and that single doses up to 200 mg “do not raise safety concerns for the general healthy adult population”. The FDA cites 400 milligrams a day for most adults “as an amount not generally associated with negative effects”. In pregnancy EFSA’s figure is 200 mg a day: intakes “up to 200mg per day consumed throughout the day do not raise safety concerns for the foetus”. Not every source agrees: James (2021) concluded that “the cumulative scientific evidence supports pregnant women and women contemplating pregnancy being advised to avoid caffeine”. If you are pregnant, the FDA recommends “talking to your health care provider about whether you need to limit caffeine consumption”. The opening day’s 210 mg is about half of 400 mg, and this simulator is a demonstration on an average body, not advice for yours.