Hearing Range Test and Hearing Loss Simulator
Sweep a tone up to 20 kHz to find the highest pitch you can hear, compare it with your age, see its place on your cochlea and hear simulated hearing loss.
Simulator
Hold on the chart or the cochlea to hear a pitch, and drag to change it. Arrow keys step a semitone, Shift an octave; Space plays.
A demonstration, not a hearing test. Speakers, Bluetooth headphones and volume settings change the result. If you notice a change in your hearing, see an audiologist or a doctor, and if it came on suddenly, get medical help straight away.
1,000 Hz peaks 21.0 mm from the base of the cochlea. The young-adult threshold there is 3.4 dB SPL.
- Frequency The pitch being played or chosen. Drag along the chart or the cochlea, or use the arrow keys.
- 1,000 Hz
- Nearest note In equal temperament on A4 = 440 Hz, with how many cents sharp or flat of it the pitch is.
- B5 +21 ¢
- Place on the cochlea Where this pitch peaks on the basilar membrane, 35 mm long, from Greenwood’s formula (1990): high pitches near the base, by the middle ear, low pitches at the apex.
- 21.0 mm from the base
- Wavelength in air The speed of sound, 343 m/s, divided by the frequency.
- 34.3 cm
- Threshold The quietest tone at this pitch a young adult hears in quiet, by Terhardt’s formula (1979): the top of the chart’s shaded floor. Not given above 16 kHz, where the formula climbs far faster than any measurement.
- 3.4 dB SPL
- Highest heard Find my limit runs three descending and three ascending sweeps and takes their geometric mean.
- Not yet
Citing this tool
Last updated . Add the date you accessed it as well, which a citation of a page that can change asks for. If a specific result matters, cite the permalink from the tool’s share row instead of this page: it reproduces the exact parameters.
On the syllabus: MCAT, 6A: Sensing the environment.
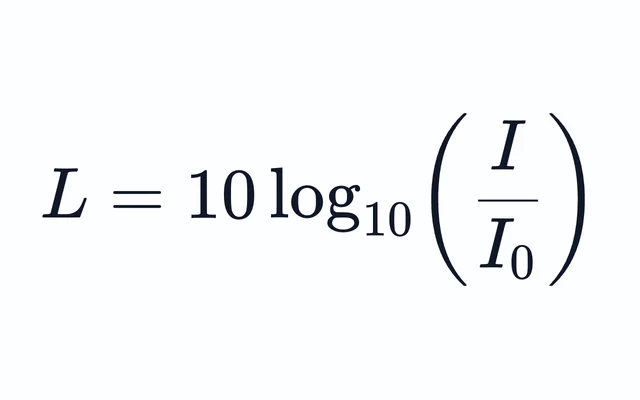
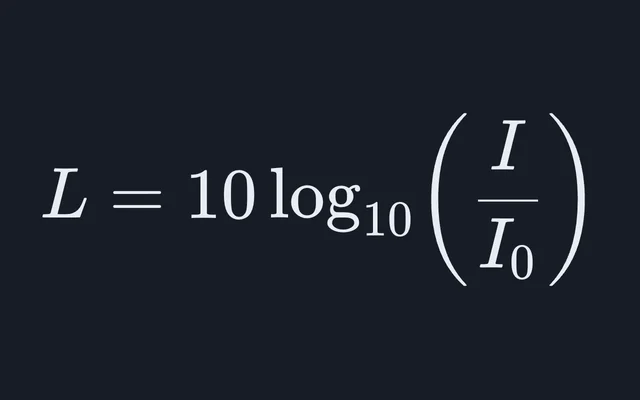
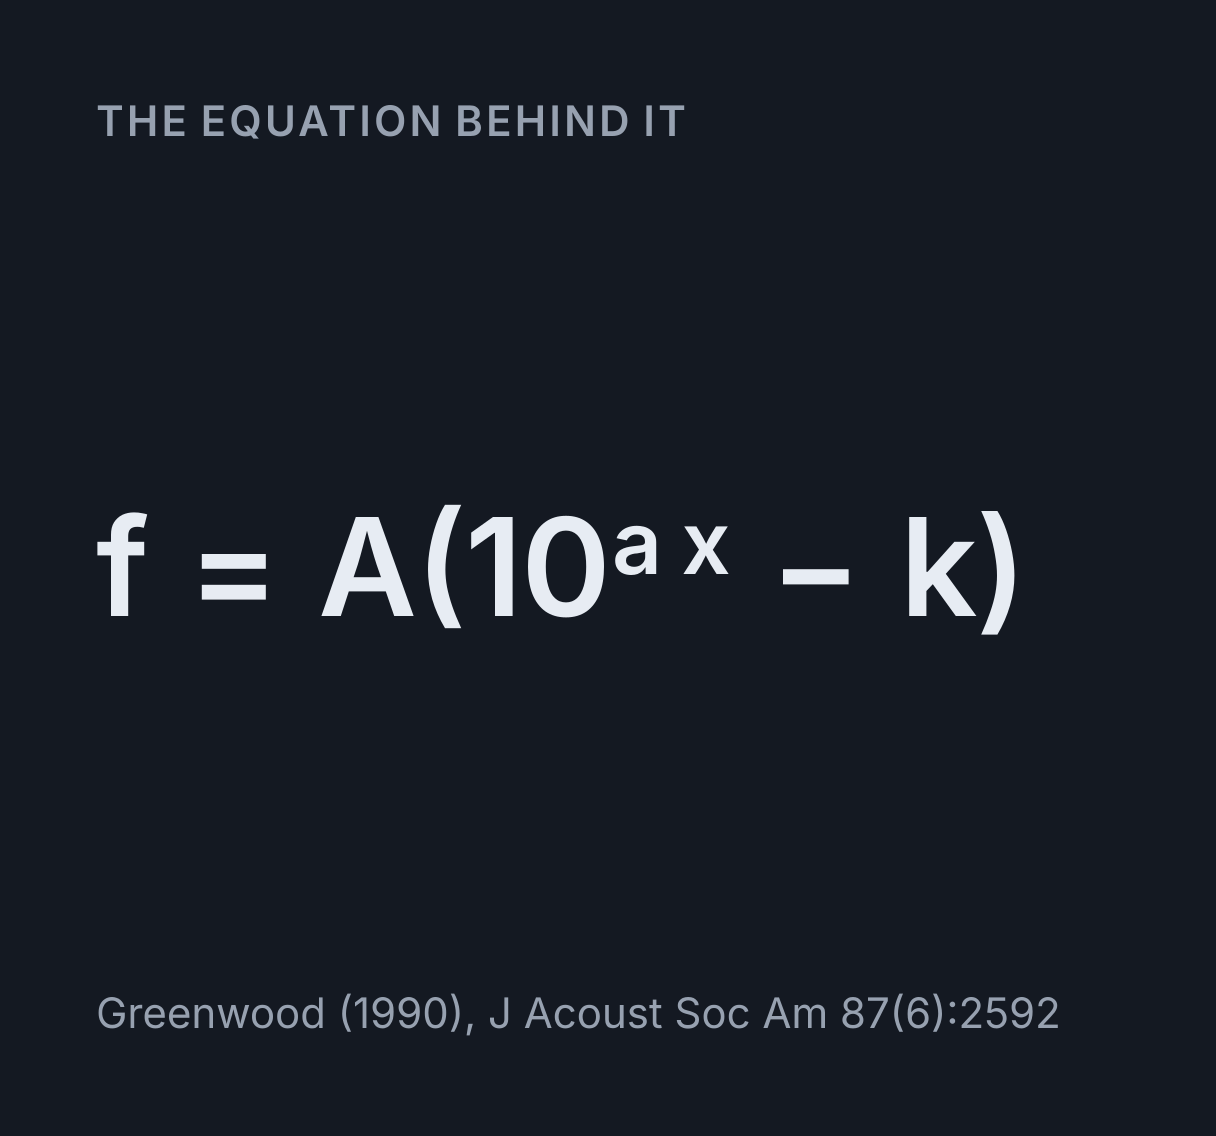
The equation
Greenwood (1990), J Acoust Soc Am 87(6):2592
What is the normal human audible hearing frequency range?
The normal young human ear hears sound frequencies from about 20 Hz to 20,000 Hz (20 kHz). It is most sensitive near 3.3 kHz, and tones near either end of that range must be far more intense to be heard at all. Age-related hearing loss (presbycusis) lowers the upper limit first, and the top end starts to fall in early adulthood.
A pitch is a place
Inside the cochlea, the spiral of the inner ear, runs the basilar membrane, about 35 mm long when it is unrolled. It is narrow and stiff at its base, by the middle ear, and wide and floppy at its far end, the apex. A sound sets off a wave that travels along it from the base and peaks at the one place whose stiffness matches the sound’s frequency, and the hair cells there are the ones that respond. High pitches peak near the base and low pitches near the apex, so the membrane sorts a sound into its frequencies the way a prism sorts light into colours.
Greenwood’s formula gives the place for every pitch: f = A(10^(ax) − k), with
A = 165.4 Hz, a = 2.1 and k = 0.88 for the human ear, where x is how far along the membrane the place
is, as a fraction of its length measured from the apex. At the apex it gives 19.85 Hz and at the base
20,677 Hz, close to the 20 Hz to 20 kHz usually quoted for young ears. That is the map this simulator
draws: the ribbon at the top is the membrane unrolled, with the apex on the left so that pitch rises
from left to right on the ribbon and on the chart below it alike.
Worked example: 1 kHz and 16 kHz on the ribbon
- 1 kHz. Inverting the formula,
x = log₁₀(f/A + k) / a. For 1,000 Hz, f/A + k = 6.9259, whose logarithm is 0.8405, and 0.8405 / 2.1 = 0.4002: the place is 40.0 percent of the way from the apex. On a 35 mm membrane that is (1 − 0.4002) × 35 = 21.0 mm from the base, the figure the readout and the pointer above the wave show. - 16 kHz. f/A + k = 97.615, whose logarithm is 1.9895, so x = 0.9474, and the place is (1 − 0.9474) × 35 = 1.8 mm from the base. Four octaves up from 1 kHz the wave has moved 19.2 mm.
- The top octave. 10 kHz peaks 5.2 mm from the base and 20 kHz 0.24 mm from it, so the whole octave from 10 to 20 kHz occupies just 5.0 mm, the stretch nearest the middle ear.
Above about 1 kHz every octave takes nearly the same length, 4.4 mm at 1 kHz rising to 5.0 mm at 16 kHz, which is why the cochlea is often called a logarithmic frequency analyser: it breaks a sound into its frequencies, the job the Fourier series visualiser does with sines. At 100 Hz an octave gets only 2.0 mm, and everything from 20 to 100 Hz is crowded into the last 2.9 mm at the apex. The lines joining the ribbon to the chart show it: they run nearly straight down at the high end and fan out at the low end, where the chart’s even decades take far more room than the membrane gives them.
| Frequency | Place, from the base | Wavelength in air | Young-adult threshold |
|---|---|---|---|
| 20.0 Hz | 35.0 mm | 17.15 m | 83.2 dB SPL |
| 50.0 Hz | 33.8 mm | 6.86 m | 40.0 dB SPL |
| 100 Hz | 32.1 mm | 3.43 m | 23.0 dB SPL |
| 250 Hz | 28.7 mm | 1.37 m | 11.0 dB SPL |
| 500 Hz | 25.1 mm | 68.6 cm | 6.3 dB SPL |
| 1,000 Hz | 21.0 mm | 34.3 cm | 3.4 dB SPL |
| 2,000 Hz | 16.4 mm | 17.2 cm | −0.3 dB SPL |
| 4,000 Hz | 11.7 mm | 8.6 cm | −3.4 dB SPL |
| 8,000 Hz | 6.8 mm | 4.3 cm | 4.8 dB SPL |
| 12,500 Hz | 3.6 mm | 2.7 cm | 24.9 dB SPL |
| 16,000 Hz | 1.8 mm | 2.1 cm | 65.9 dB SPL |
| 20,000 Hz | 0.24 mm | 1.7 cm | not used above 16 kHz |
The wavelengths run from 17.15 m at 20 Hz to 1.7 cm at 20 kHz, the speed of sound divided by the frequency, as the wavelength and frequency calculator works it out. The cochlea does not hear wavelengths, though: the membrane responds to how fast the pressure changes, not to how far apart its peaks are in the air.
The threshold curves up at both ends
The shaded floor of the chart is the quietest tone a young adult can hear at each frequency in a quiet room, by Terhardt’s formula of 1979. It is lowest, −5.0 dB SPL, near 3.3 kHz, where the ear canal’s resonance helps, and 3.4 dB SPL at 1 kHz. It climbs to 83.2 dB SPL at 20 Hz, so a very low tone must be about 80 dB more intense than a 1 kHz tone to be heard at all, and to 65.9 dB SPL at 16 kHz. Above 16 kHz the formula is not used: its last term gives 105 dB at 18 kHz and 160 dB at 20 kHz, which no measurement supports. The chart dots its last stretch from 12.5 kHz, because there it already climbs faster than measured thresholds do: 41 dB from 12.5 to 16 kHz, where the 10 to 21 year olds Lee and colleagues tested in 2012 rose 21 dB.
Decibels here are dB SPL, sound pressure level against 20 micropascals. An audiogram uses dB HL instead, hearing level, which counts from the average young ear’s threshold at each frequency, so 0 dB HL is normal hearing everywhere. The decibel calculator does the arithmetic of both.
Typical upper limit by age, as a band
Age lifts the threshold at the top first. The bands at the top right of the chart come from one study: Lee and colleagues measured 352 listeners aged 10 to 65, all with normal audiograms up to 4 kHz, at 21 frequencies from 125 Hz to 20 kHz, and published the mean threshold of each age group (Ear and Hearing, 2012, Table 1). For each group the band runs from the frequency at which its mean threshold has risen 40 dB above its own threshold at 1 kHz to the one at which it has risen 60 dB: roughly where a tone that is clearly audible at 1 kHz, and played at the same level at every pitch, fades out.
| Age | Typical upper limit |
|---|---|
| 10 to 21 | 16.1 to 17.3 kHz |
| 22 to 35 | 15.0 to 16.5 kHz |
| 36 to 45 | 13.0 to 14.4 kHz |
| 46 to 55 | 12.1 to 13.5 kHz |
| 56 to 65 | 9.7 to 11.7 kHz |
It is a band, and never a single “hearing age”, for three reasons. The level at your ear is unknown, so the band spans 20 dB of it. People of the same age differ by far more than the band is wide. And an average of a group cannot say where in the group one person sits. The study’s volunteers all had normal audiograms up to 4 kHz, so these are better ears than the average for each age, and its equipment could play no more than 105 dB SPL: listeners who did not respond were recorded at that limit, which was 25 percent of them at 12.5 kHz and 84 percent at 20 kHz, so the averages near the top are floors and the true bands may sit a little lower.
How to run it well
- Wired headphones in a quiet room. Laptop and phone speakers produce little below about 100 Hz and roll off at the top, and some Bluetooth headphones compress sound in ways that cut the highest frequencies before they reach you.
- Set the level once. Play the 1 kHz reference and set your device’s volume so it is quiet but clear, then leave the volume alone. Nothing here plays more than 10 dB above the reference, and every tone fades in and out over 30 ms, because an abrupt start is a click that anyone can hear, which would fake a result at 19 kHz.
- Never chase a tone. Do not turn the volume up to find a tone you cannot hear. You may not hear it, but it can still be loud enough to harm your ears or a small speaker. This matters most for children, who hear the highest tones best.
- Know your device’s ceiling. A browser plays nothing above half its sample rate, and this page stops at 0.45 of it, where audio converters start to cut: 19,845 Hz at 44.1 kHz. The sampling and aliasing visualiser shows why. A small speaker pushed hard, or a device’s own sound processing, can also add faint sounds at lower pitches, which the ear hears far more easily: if a very high tone sounds like a lower one, or like a buzz, that is your equipment, not your hearing.
Finding your limit: the method of limits
Find my limit sweeps at the same pace as the main sweep, 20 Hz to 20 kHz in 30 s, which is 3.01 s for every one of its 9.97 octaves. Three runs start high and fall until you hear the tone; three start lower and rise until it has gone. They alternate because reaction time pulls each kind the opposite way: at a typical 0.35 s, a falling run has moved 0.12 octave past your limit before you press, and a rising run 0.12 octave beyond it, so for a true limit of 15 kHz the falling runs read 13.8 kHz and the rising ones 16.3 kHz. The estimate is the geometric mean of all six, which cancels that bias, with their spread in octaves. Two silent catch trials are mixed in at random, and a press during one is counted as a false alarm. While a run is going the pitch is hidden from the chart, so only your ears decide. The runs play 10 dB above the reference you set, the loudest this page goes, so the tone is clearly audible wherever your hearing is good, which is what the age bands assume: at a quieter level the same ears give a lower limit.
Why high pitches go first
Every sound passes the base of the cochlea on its way to its own place, and the hair cells there, which answer the highest pitches, are the first to be lost with age and with some drugs. Years of loud noise usually strike a little further in, near 4 kHz, still in the cochlea’s first turn, which is the dip the noise preset shows. Hair cells do not grow back. So the top octave, the basal 5 mm, is where hearing usually starts to fade with age, and the shrinking bands in the chart show it: the 56 to 65 year olds’ band sits more than 5 kHz below the 10 to 21 year olds’. Equipment can do the same thing without any help from the ear, which is why a missing top end on laptop speakers says nothing about your hearing.
What the hearing loss simulator does and does not do
An audiogram becomes a filter that turns each frequency down by the hearing level there: a linear-phase filter of 2,047 taps at 44.1 or 48 kHz, so every frequency is delayed by the same 23.2 ms or 21.3 ms, and the plain sound is delayed to match, so switching between with and without the loss lands on the same moment of the music. It never amplifies, and it lands within 1 dB of every point of every preset. A filter of that length cannot turn sharply at the low end, though, where the points are only a few hundred hertz apart: a step dragged by hand of more than about 30 dB between 250 and 500 Hz, or 70 dB between 500 Hz and 1 kHz, comes out smoothed, so 0 dB at 250 Hz beside 80 dB at 500 Hz gives about 69 dB at 500 Hz. Turning frequencies down can still raise a sound’s peaks, because what is left adds up differently, so the result passes a hard ceiling that holds its peaks to the level you set. The WHO grade on the audiogram is read from the average of 500, 1000, 2000 and 4000 Hz, as the World Report on Hearing (2021) grades the better ear: under 20 dB HL is normal, then mild, moderate, moderately severe, severe, profound, and complete from 95 dB HL.
The age presets are each group’s mean threshold less that of the 10 to 21 year olds, from the same study. The one for 56 to 65 year olds is only 5.9 dB HL on the four-frequency average, normal by the WHO grade, yet 26.4 dB down at 8 kHz and 58.2 dB at 12.5 kHz: listen to the hi-hats lose their shine while speech frequencies barely change.
What a filter cannot do is the rest of hearing loss. A damaged cochlea also makes loud sounds grow too fast, called loudness recruitment, and blurs nearby pitches together, because its frequency analysis loses its sharpness, as Moore sets out in Cochlear Hearing Loss (second edition, 2007). Turning sounds down copies neither, so real hearing loss is harder to listen through than this, especially speech in noise, and turning sounds up alone cannot undo it.
Why this is not a hearing test
A hearing test measures each ear separately in dB HL with an audiometer whose earphones are calibrated to known levels, in a quiet booth. This page plays sound at a level it cannot know through equipment it cannot see, so its numbers belong to your setup as much as to your ears, and it gives no pass or fail. Even a real audiogram is not the whole story: the WHO notes that the ability to detect pure tones in a quiet room is not, in itself, a reliable indicator of hearing disability. If you notice a change in your hearing, see an audiologist or a doctor, and if it came on suddenly, in one ear or both, get medical help straight away, because sudden hearing loss can need treating quickly.
The travelling wave on the ribbon
The wave is drawn, not solved. Its shape follows the sketches von Békésy made from his measurements in Experiments in Hearing (1960): an envelope that peaks at Greenwood’s place, rising gently over about 7 mm on the side towards the base and dying within about 1.5 mm beyond its peak, with the crests crowding together as the wave slows. The real wave runs at the tone’s own frequency, far too fast to see, so the drawing runs at one cycle a second. For waves on a string, where the speed is the same everywhere, the standing wave simulator is the place to look.
Model and assumptions
- Method
- Exact expression, no time stepping
- Repeatability
- Deterministic. The same link gives the same numbers on any machine.
What it assumes
- Each pitch peaks where Greenwood’s 1990 frequency-position function for the human cochlea puts it, f = 165.4(10^(2.1x) − 0.88) Hz, on a basilar membrane taken as 35 mm long.
- The young-adult threshold is Terhardt’s 1979 fit to the threshold in quiet, drawn only up to 16 kHz and dotted above 12.5 kHz, where it climbs faster than measurements do.
- The typical upper limits by age are where the mean thresholds that Lee and colleagues published in 2012 for 352 listeners aged 10 to 65 rise 40 and 60 dB above each group’s own threshold at 1 kHz.
- The travelling wave is drawn rather than solved, a schematic after von Békésy’s envelope that peaks at Greenwood’s place, and nothing on the page is read from it.
- The limit finder is the method of limits: three descending and three ascending sweeps at 3.01 s an octave, averaged geometrically so that reaction time cancels between the two directions.
- The hearing loss is attenuation alone, a linear-phase filter that lowers each frequency by its hearing level, capped at 80 dB, and never amplifies. A hard ceiling after it holds the filtered sound’s peaks to the level set, since turning frequencies down can still raise them.
- Every level is relative to digital full scale, because no browser knows how loud its sound arrives at the ear.
Where it stops holding. Anything clinical. Without a calibrated audiometer, earphones of known response and a quiet booth, the level of each tone at the ear is unknown, so a limit found here belongs to the device and its volume as much as to the ear. The loss simulator also leaves out loudness recruitment and the loss of frequency selectivity, which make real hearing loss harder to listen through than attenuation alone.
Numerical accuracy
No time stepping, so nothing accumulates. The place on the cochlea, the threshold, the wavelength and the WHO grade are closed forms, exact to rounding, and the age bands are straight-line readings of Lee and colleagues’ published means on a log frequency axis. The loss filter is approximate by construction: a 2,047-tap linear-phase filter, longer at sample rates above 50 kHz, cannot follow an audiogram’s corners exactly, so it is designed by frequency sampling with a Kaiser window and corrected in three passes until it lands within 1 dB of every point of every preset, and it is scaled so that it never amplifies. A step dragged by hand at 1 kHz or below can be steeper than 2,047 taps can follow, more than about 30 dB from 250 to 500 Hz or 70 dB from 500 Hz to 1 kHz, and comes out smoothed: 0 dB at 250 Hz beside 80 dB at 500 Hz gives about 69 dB at 500 Hz. The limit estimate carries the reader’s reaction time and the device’s output latency where the browser reports it; alternating descending and ascending runs cancels the reaction’s bias of about 0.12 octave a run.
Common questions
What is the normal range of human hearing?
About 20 Hz to 20 kHz in young people, and the top end starts to fall in early adulthood. The cochlea shows why it goes first: on Greenwood’s map the whole top octave, 10 to 20 kHz, takes only 5.0 mm of a 35 mm membrane, the stretch nearest the middle ear, where hair cells are lost first with age. The ear is most sensitive near 3.3 kHz, at −5.0 dB SPL by Terhardt’s formula, while by the same formula a 20 Hz tone needs 83.2 dB SPL to be heard at all.
What frequency should I be able to hear at my age?
On the average thresholds that Lee and colleagues measured in 2012 in 352 people with normal audiograms, a tone 40 to 60 dB above the threshold at 1 kHz, played at the same level at every pitch, fades between 16.1 and 17.3 kHz for 10 to 21 year olds, 15.0 and 16.5 kHz for 22 to 35, 13.0 and 14.4 kHz for 36 to 45, 12.1 and 13.5 kHz for 46 to 55, and 9.7 and 11.7 kHz for 56 to 65. Each is a band because the level your device plays at is unknown, and only a calibrated test can say where you are.
Can an online hearing age test tell how old my ears are?
No. A hearing age would need a known level, and a browser does not know how loud its tone arrives: the volume control and the headphones decide that, and moving it 20 dB moves the frequency at which a tone fades by a kilohertz or more. People of the same age also differ by far more than that, and an average for an age group cannot say where one person sits in it. So this page shows a band for each age group and never a single hearing age, and it is a demonstration, not a hearing test: if you notice a change in your hearing, see an audiologist or a doctor, and if it came on suddenly, get medical help straight away.
Why can’t I hear the highest tones?
Partly age and noise, and partly equipment. Age takes the highest pitches first, at the base of the cochlea, and years of loud noise usually start near 4 kHz. Laptop and phone speakers and some Bluetooth headphones lose the top of the range before it reaches you, so try wired headphones before drawing any conclusion. And a browser cannot play above half its sample rate: this page stops at 0.45 of it, 19,845 Hz on a device running at 44.1 kHz.
How does the hearing loss simulator work?
It turns the audiogram into a filter that lowers each frequency by the hearing loss there, plays music or your own file through it, and lets you switch between with and without, crossfaded over 50 ms. The filter matches every preset within 1 dB at each point and never amplifies, though a step dragged by hand at 1 kHz or below that is steeper than it can follow comes out smoothed. Real hearing loss also makes loud sounds grow too fast and blurs nearby pitches together, which a filter cannot reproduce, so real loss is harder to listen through than this (Moore 2007).
Where on the cochlea is each frequency heard?
Greenwood’s formula, f = 165.4 × (10^(2.1x) − 0.88) Hz with x the fraction of the way from the apex, maps pitch to place. On a 35 mm cochlea 1 kHz peaks 21.0 mm from the base, 4 kHz 11.7 mm, 8 kHz 6.8 mm and 16 kHz 1.8 mm, so each octave above 1 kHz gets about 4.4 to 5 mm, while everything from 20 to 100 Hz shares the last 2.9 mm at the apex.
Can a high-pitched test tone damage my hearing or my speakers?
It can if played loud enough, which is why this page starts quiet, never plays more than 10 dB above the 1 kHz reference you set, and fades every tone in and out over 30 ms. Never turn your device up to chase a tone you cannot hear: you may not hear it, but it can still be loud enough to harm your ears or a small speaker.