Live Spectrogram and Spectrum Analyzer
Free online spectrogram and spectrum analyser. Use your microphone or an audio file and watch pitch, harmonics and formants scroll past, on your device.
Visualiser
Point at or drag across the picture to read any moment and frequency, or use the arrow keys. Space plays and pauses.
Showreel. Three sung vowels, a whistle, three phone keys and a chirp, on a 12 second loop.
Demo sounds
- Pitch The fundamental, found by the YIN method of de Cheveigné and Kawahara (2002) in the 42.7 ms around the newest column, searched from 50 Hz to 2 kHz. It is how often the waveform repeats, so it can sit below the loudest line: for a voice the loudest is often the second or third harmonic. The note is the nearest in equal temperament on A4 = 440 Hz, with cents to it. Unclear means nothing repeats clearly enough between 50 Hz and 2 kHz to name one: noise does not repeat at all, and a whistle above 2 kHz repeats too fast.
- none
- Loudest frequency The largest bin in view, refined between bins by a parabola through it and its two neighbours on the dB scale, which with the Hann window puts a tone a few bins clear of 0 Hz within 0.02 bin of its frequency and within 0.33 dB of its level.
- silence
- Level The RMS of the 50 ms at the middle of the column the live spectrum shows, in dBFS on the AES17 scale, where a full-scale sine reads 0. The clip flag shows when a sample there reaches −0.1 dBFS, the edge of what the samples can hold.
- silence
- Frequency resolution Δf = fs/N = 48,000/4096 = 11.72 Hz between bins. A Hann window needs about two bins between two tones to show them as two lines.
- 11.7 Hz
- Window and hop Each column looks at N/fs = 85.3 ms of sound, and a new one starts every N/4 samples, 21.3 ms later, so every sample is in four columns.
- 85.3, 21.3 ms
- Sample rate and Nyquist The rate the sound is analysed at, and half of it, the Nyquist frequency: the highest frequency the samples can hold. A microphone runs at the device’s own rate, often 48 kHz.
- 48, 24 kHz
Citing this tool
Last updated . Add the date you accessed it as well, which a citation of a page that can change asks for. If a specific result matters, cite the permalink from the tool’s share row instead of this page: it reproduces the exact parameters.
The equation
Koenig, Dunn and Lacy (1946), The Sound Spectrograph
What a spectrogram shows
A spectrogram is a picture of sound. Time runs from left to right, frequency runs up, and how loud each frequency is at each moment is a colour. It is built from short-time Fourier transforms: the sound is cut into short overlapping slices, each slice is tapered to zero at both ends by a window, and a fast Fourier transform turns it into one column of levels. At the default FFT size of 4096 samples at 48 kHz, each column covers 85.3 ms of sound, its levels are 11.7 Hz apart, and a new column starts every 21.3 ms, so about 47 arrive every second.
Above the picture is the newest 40 ms of the waveform itself, held still on a rising zero crossing so that a steady tone does not drift, as the trigger of an oscilloscope holds it. To the right is the live spectrum: the newest column drawn sideways on the same frequency axis, so each peak lines up with the band it is drawing, or on a phone laid flat underneath. On a wider screen a keyboard from C1 to C8 runs beside the log axis and lights the key nearest the pitch.
The colours are Magma, the colour map Nathaniel J. Smith and Stéfan van der Walt made for matplotlib and released under CC0. It runs from black at the floor through violet and red to pale yellow at the ceiling, getting brighter evenly all the way, so the picture still reads in greyscale and for the common kinds of colour blindness. With the default range of −100 to 0 dBFS, violet is about −70 dBFS and orange about −25. Everything blue is yours, the crosshair and the peak marker, and everything amber is pitch: the pitch trace and the note at its newest end, the harmonic ladder and the lit key.
Under the picture, every demo has a card showing its own spectrogram in miniature, analysed from the same samples, so you can see what each one draws before you choose it. The demos run silently, and the picture is the same either way. Turn on Play sound to hear one: everything this page plays, demos and files alike, is scaled so its loudest moment peaks at −18 dBFS and fades in and out over 20 ms, so nothing starts with a bang. The phone keypad sounds one key at a time, so a key you press takes over from the one already sounding instead of adding to it. Here is the showreel, second by second, at the default settings.
- 0 to 3.45 s, three sung vowels. Heed on C3 has a fundamental of 130.8 Hz, wavering by 2 percent either way five and a half times a second, the vibrato, with a harmonic at every whole multiple above it. Its brightest line is the second harmonic, 261.6 Hz, almost on heed’s first formant at 270 Hz, and a second bright band, the 17th and 18th harmonics at 2224 and 2355 Hz, marks its second formant at 2290 Hz. Hod on E3 lights up a block from 659 to 989 Hz, its fourth to sixth harmonics, where its first two formants, 730 and 1090 Hz, sit close together. Who’d on G3 is brightest at its fundamental, 196 Hz, and fades fast above 1 kHz.
- 3.85 to 5.45 s, a whistle. One thin line rising from 1.2 to 2.8 kHz, because a whistle is very nearly a pure tone.
- 5.9 to 7.1 s, the phone keys 1, 2 and 3. Each is two lines at once. The lower stays at 697 Hz, the keypad’s top row, while the upper steps from 1209 to 1336 to 1477 Hz, one column to the next.
- 7.6 to 11.2 s, a chirp from 50 Hz to 16 kHz. It climbs 8.32 octaves at a steady 2.31 octaves a second, so on the log axis it is a straight line. Its low end is thicker, because the bins are 11.7 Hz apart: near 50 Hz a line a few bins wide spans half an octave of the log axis, while above 1 kHz the line is about a tenth of an octave thick, most of that the chirp’s climb during one window.
Using your microphone
Press Use your microphone and your browser asks whether this page may use it, unless you have allowed it before. The page asks for the microphone with echo cancellation, noise suppression and automatic gain control switched off, because each of them changes what is heard: noise suppression removes steady tones, a whistle among them, and automatic gain control evens out loud and quiet. Some phones keep one of them on anyway, and when the browser reports that, the stage says which.
The sound is analysed here, in your browser, as it arrives. This page’s code keeps the picture and the last fraction of a second it is working on, and never records, stores or sends the sound anywhere. The page address holds your settings and the demo you chose, and never anything that was heard.
While the page is listening, a pill reads Listening on this device. Stop, Pause and Space, switching to the demos or to a file, hiding the tab and leaving the page all stop every track of the stream, which is what puts out your browser’s own microphone indicator. From the microphone a column is taken every animation frame and stamped with the audio clock, so if the page stalls, the gap shows as a gap instead of squeezing time together.
An audio file works the same way, without any permission. Choose one, or drop it on the screen: anything your browser can decode, up to 10 minutes and 200 MB. It is decoded and analysed here and is not uploaded, and the whole file is drawn as the analysis goes. Then press Play to hear it, and tap or drag on the picture to move the playhead.
Pitch, harmonics and the missing fundamental
A voice, a string or a pipe makes harmonics: lines at whole multiples of one frequency, the fundamental, which is the pitch you hear. A note on E3, 164.8 Hz, has lines at 329.6, 494.4 and 659.3 Hz and on up. The loudest of them is often not the fundamental, and on hod it is usually the fourth. So the Pitch readout does not read the loudest line. It uses the YIN method of de Cheveigné and Kawahara (2002), which works in time rather than frequency: it slides about 43 ms of signal along itself and finds the shortest shift at which it matches, which is the period, and the pitch is one over that. It searches from 50 Hz to 2 kHz and names a pitch only when the match passes a threshold of 0.12, a little looser than the 0.1 of the paper’s own tests; otherwise the readout says unclear. The amber trace across the picture is the same reading, column by column.
Because it measures repetition, YIN hears what the ear hears when the fundamental itself is missing. Harmonics 2 to 6 of 200 Hz, from 400 to 1200 Hz with nothing at 200 Hz, still repeat every 5 ms, and read 200 Hz. That is the missing fundamental, and it is why a voice on an old telephone line, which carried little below 300 Hz, still sounded at its true pitch. Turn on Harmonics and put the crosshair on a line: rungs appear at 2 to 10 times its frequency, and when a stack of lines sits on the rungs, it is one sound. The square, sawtooth and triangle demos are built from the same coefficients as the Fourier series visualiser, so their ladders of odd and even harmonics are the ones it adds up, and a string or a pipe sounds its harmonics because of the standing waves the standing wave simulator draws.
Repetition can fool it too. A phone key is two tones chosen not to be harmonics of one note, so that speech is unlikely to imitate them, yet two steady tones nearly repeat at some shift, and the Pitch readout names a pitch for every key: the showreel’s keys 1, 2 and 3 read about 239, 674 and 731 Hz, though they play no tone at any of them. Key A comes closest to repeating: 697 and 1633 Hz are almost exactly the third and seventh harmonics of 233 Hz, and the Pitch readout names 233.1 Hz.
Vowels and formants
Every vowel sung on the same note has the same harmonics; what changes is which of them are loud. The air from your vocal folds to your lips is a tube, and it resonates at a few frequencies, the formants, which boost the harmonics near them. Moving the tongue and the lips changes the tube’s shape and moves the formants. Peterson and Barney measured them in 1952 for 76 speakers, and these are their averages for the 33 men:
| Vowel | F1 (Hz) | F2 (Hz) | F3 (Hz) | Tongue |
|---|---|---|---|---|
| heed /i/ | 270 | 2290 | 3010 | high and front |
| hod /ɑ/ | 730 | 1090 | 2440 | low and back |
| who’d /u/ | 300 | 870 | 2240 | high and back, lips rounded |
The demo builds each vowel the same way: a source at the vocal folds whose harmonics fall by 12 dB an octave, the radiation from the lips, which lifts them by 6 dB an octave, and three resonators from Klatt’s 1980 speech synthesiser, set at those averages with bandwidths of 80, 100 and 150 Hz chosen for the demo. While a vowel sounds, the drawing in the corner of the screen shows where the tongue is. High and forward for heed leaves a wide throat and a small space in the mouth, so F1 is low and F2 high. Low and back for hod narrows the throat and opens the mouth, which raises F1 and brings F2 down towards it. High and back with the lips rounded for who’d lengthens the tube and lowers both. The larynx hangs from the hyoid, the small bone you can find in the head and neck explorer.
Time against frequency resolution
A column’s bins are Δf = fs/N apart, and its window lasts N/fs. Both come from
the one number, the FFT size N, so finer frequency costs coarser time and the other way round. At 48 kHz:
| FFT size | Bins apart (Hz) | Window (ms) | Hop (ms) |
|---|---|---|---|
| 512 | 93.8 | 10.7 | 2.67 |
| 1024 | 46.9 | 21.3 | 5.33 |
| 2048 | 23.4 | 42.7 | 10.7 |
| 4096 | 11.7 | 85.3 | 21.3 |
| 8192 | 5.86 | 171 | 42.7 |
| 16384 | 2.93 | 341 | 85.3 |
Two tones show as two lines only when they are about two bins apart, because a Hann window spreads each tone across about four bins. At 48 kHz, 440 and 446 Hz show as two steady lines only at 16384, and only just. At every smaller size they merge into one line whose brightness pulses six times a second, which is what beats look like, and the pulsing is deeper the smaller the size. The Beats demo, 440 and 444 Hz, is closer still: it pulses four times a second at every size, and even at 16384, where its tones are 1.4 bins apart, it never settles into two steady lines.
A large size also blurs anything quick. The edges of the phone keys and the wobble of the vibrato smear at 16384, where one window lasts 341 ms. The chirp climbs 0.79 of an octave inside one such window, so it thickens along its whole length, though its low end, with bins now 2.93 Hz apart, comes out sharper than at 4096. Change the FFT size while a demo runs: new columns take the new size at once, and a dashed line labelled with the new bin spacing marks where it changed. Set the window to rectangular and every tone grows a wide skirt either side. That is leakage, which a tapered window like Hann is there to reduce.
Hum, aliasing and other things you will see
Mains hum is a line at 50 Hz in the UK, Europe, India and Australia, or 60 Hz in the US and Canada, often with harmonics at 100 and 150 Hz or at 120 and 180 Hz, picked up by a cable or a charger near the microphone. On the keyboard 50 Hz is G1 +35 ¢, and 60 Hz is B1 −49 ¢, almost exactly between two notes.
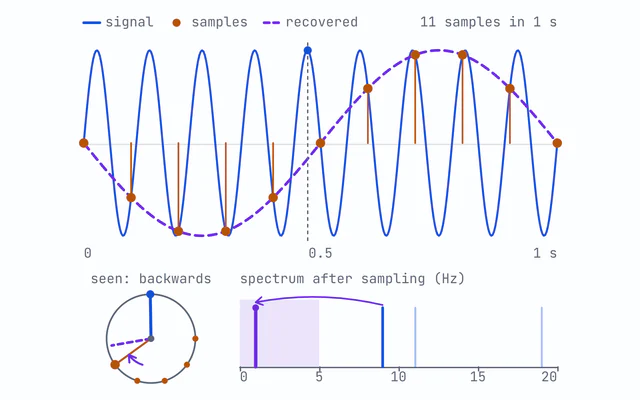
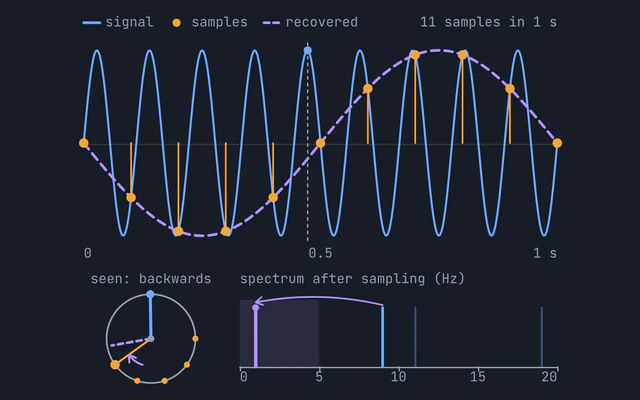
Aliasing. Samples cannot hold anything above half their rate, the Nyquist frequency, so a
tone above it reappears below it, folded back as if by a mirror: sampled at fs, a tone at f shows at
|f − k fs|, where k is the whole number nearest f/fs. The Aliasing sweep demo samples a rising
tone at the rate you set, 8 kHz to begin with, with no filter in front. The line climbs to the dashed
Nyquist line at 4 kHz and folds back down while the tone itself, the faint dashed line, carries on up, so a
5 kHz tone shows at 3 kHz. Real recorders filter out everything above the Nyquist frequency before they
sample, for exactly this reason, and the
sampling and aliasing visualiser takes the fold apart
slowly.
Noise near the top. High up a log axis one row of the picture spans many bins, and it shows the loudest of them, which is what keeps a single thin line from fading into its neighbours. For a hiss that flatters the top rows: white noise, the same power in every hertz, looks brighter the higher it goes, and pink noise, whose power in each hertz falls 3 dB an octave, looks flatter than it is.
Other marks. A bright vertical stripe across every frequency is a click: something that changes in an instant contains every frequency at once. A band along the very bottom is rumble, from wind or from handling the microphone; on the linear and mel axes, which start at 0 Hz, a line right on the bottom edge can also be an offset in the signal. A line that bends smoothly down as something passes is the Doppler effect, which the Doppler effect simulator works out.
What this analyser leaves out
- Your microphone and speakers. Levels are in dBFS, decibels relative to the largest value the samples can hold, not sound pressure in the room: the same voice reads louder close to the microphone, or through a more sensitive one. Built-in microphones are usually less sensitive at the lowest and highest frequencies, so the picture shows what reached the samples rather than what was in the air. The decibel calculator converts between decibel scales.
- The device’s sample rate. The microphone is analysed at whatever rate the device runs, often 48 or 44.1 kHz. A file is decoded at that rate once the page has played a sound or opened the microphone, and at 48 kHz before then, resampled by the browser if it was made at another. The Nyquist frequency is half of it, and the top of the axis stops there.
- Processing a phone may keep on. The page asks for echo cancellation, noise suppression and automatic gain control to be off. Some phones keep one on regardless; the stage says so when the browser admits it, and not every browser does.
- More than one pitch. YIN finds one period. Two voices, a chord or a strong echo give it several, and it reports the louder voice, a longer period they share, or none: C, E and G sung together on middle C read C2, two octaves below the lowest of them.
- The room. Echoes smear every line to the right, and a noisy room raises the floor.
Common mistakes
- Reading the loudest line as the pitch. On hod the loudest line is usually the fourth harmonic, 659 Hz, two octaves above the 164.8 Hz you hear. Read the Pitch readout or follow the amber trace.
- Raising the FFT size to see more. A larger size separates close frequencies but smears quick changes. Speech changes every few tens of milliseconds and reads best from 1024 to 4096; a held note can take 8192 or 16384.
- Taking dBFS for loudness. 0 dBFS is the largest value the samples can hold, not a sound level, and −20 dBFS is a tenth of that amplitude, whether it is a whisper close up or a shout across a room.
- Taking a harmonic for a second note. A stack of evenly spaced lines is one sound. Turn on Harmonics and check that the lines sit on the rungs.
- Believing an aliased line. A line that bounces off a fixed height as it rises is folding at the Nyquist frequency, not a real tone coming down.
Common questions
What is a spectrogram?
A picture of sound, with time across, frequency up and loudness as colour, built from short overlapping Fourier transforms. At the default of 4096 samples at 48 kHz, each column covers 85 ms, its levels are 11.7 Hz apart and a new column arrives every 21 ms.
Does the spectrogram record or upload my microphone?
No. This page analyses the sound in your browser as it arrives and never records, stores or sends it, and the page address holds only your settings. Stop ends listening, and pausing, hiding the tab or leaving the page stops it too, which puts out your browser’s microphone indicator.
Why does my voice show a stack of lines instead of one?
A voice or an instrument makes harmonics at whole multiples of its pitch, so a note at 164.8 Hz (E3) has lines at 329.6, 494.4 and 659.3 Hz and up. The Pitch readout finds the fundamental by the YIN method, so a sound made of harmonics 2 to 6 of 200 Hz, with nothing at 200 Hz itself, still reads 200 Hz: the missing fundamental.
What is the difference between a spectrum analyser and a spectrogram?
A spectrum analyser shows one moment, level against frequency, and a spectrogram stacks those moments into a history. Here the live spectrum sits sideways at the right edge of the spectrogram on the same frequency axis, so each peak lines up with the band it is drawing.
How do I see two close notes as separate lines?
Raise the FFT size. At 48 kHz, 1024 samples gives 46.9 Hz bins and 21 ms windows, 4096 gives 11.7 Hz and 85 ms, and 16384 gives 2.93 Hz and 341 ms. A Hann window needs about two bins between tones, so 440 and 446 Hz show as two lines only at 16384, at the price of smearing anything faster than a third of a second.
Why is there a line at 50 or 60 Hz?
It is mains hum, picked up from the electricity supply or a charger: 50 Hz in the UK, Europe, India and Australia, and 60 Hz in the US and Canada, often with harmonics at 100 and 150 Hz or at 120 and 180 Hz.
Why does a whistle make one line but a vowel make bands?
A whistle is nearly a pure tone. A vowel is a stack of harmonics whose loudest bands, the formants, are set by the shape of your mouth and throat. Peterson and Barney measured averages for adult men of 270 and 2290 Hz for the vowel in heed, and 730 and 1090 Hz for the vowel in hod.