Heat Index Chart Explorer
Find the heat index, the feels-like temperature, from air temperature and humidity or dew point on the NWS chart, with its caution to extreme danger bands.
Calculator
Drag the point to change the air. With the chart focused, the arrow keys change the air temperature by 1° and the humidity by 1 percent, 5 with Shift. Space plays and pauses.
Heat index, °C
- Caution 26.7+
- Extreme Caution 32.2+
- Danger 39.4+
- Extreme Danger 51.7+
- Beyond Steadman’s model
- Lines every 2 °C
- Dew point
- Feels like the air
A heat index chart in °C, coloured by the NWS categories. An illustrative humid day is shown at 15:00, with the dew point held at 24 °C. The air is 35 °C at 53 percent relative humidity, with a dew point of 24 °C, and it feels like 41.9 °C: Danger.
Feels like 41.9 °C, Danger, at 35 °C and 53 percent humidity.
Feels like, 15:00
41.9°C
107.4 °F
Air 35 °C, 6.9 °C hotter
Danger 39.4 to 51.7 °C
NWS: “Heat cramps or heat exhaustion likely, and heat stroke possible with prolonged exposure and/or physical activity.”
How well sweat can cool you
Wet bulb 26.8 °C, 8.2 °C below skin at 35 °C
Sweat cools skin towards the wet bulb and no further. Young, healthy adults doing light activity could no longer hold their core temperature at a wet bulb of about 31 °C in humid heat, and at lower wet bulbs still in hotter, drier air (Vecellio and others, 2022), short of the theoretical 35 °C (Sherwood and Huber, 2010).
- Dew point The temperature at which this air would start to form dew: a measure of the water it holds, whatever its temperature.
- 24 °C
- Relative humidity From the dew point: 100 × pws(dew point) / pws(air), with Hyland and Wexler’s saturation pressure.
- 53 %
- Wet bulb At sea-level pressure, from the psychrometric chart explorer’s model: the coolest that evaporating water can make anything in this air, sweating skin included.
- 26.8 °C
- Formula used The simple formula gives more than 79 °F, so Rothfusz’s regression runs, with no adjustment for this air. It is good to about ±0.7 °C.
- Rothfusz regression
A demonstration of the NWS heat index, not a safety or medical assessment. It assumes shade, a light wind and an adult walking in trousers and a short-sleeved shirt; full sunshine can add up to 15 °F (8 °C). It cannot tell you that you are safe. Follow your local heat warnings, which in many countries use other indices and thresholds.
- Heat index
- Extrapolated, beyond Steadman’s model
- Equal to the air temperature
Working, by the NWS algorithm
- T = 35 × 9/5 + 32 = 95 °F
- RH = 100 × pws(24 °C) / pws(35 °C) = 100 × 2.9851 kPa / 5.6278 kPa = 53.042 %
- simple = 0.5 × [95 + 61 + (95 − 68) × 1.2 + 0.094 × 53.042] = 96.693 °F
- The simple value is above 79 °F, so the Rothfusz regression runs.
- No adjustment: the humidity is between 13 and 85 percent.
- regression = −42.379 + 2.04901523 × 95 + 10.14333127 × 53.042 − 0.22475541 × 95 × 53.042 − 0.00683783 × 95² − 0.05481717 × 53.042² + 0.00122874 × 95² × 53.042 + 0.00085282 × 95 × 53.042² − 0.00000199 × 95² × 53.042² = 107.44 °F
- HI = (107.44 − 32) × 5/9 = 41.909 °C
Rothfusz’s fit is good to about ±0.7 °C, so the tenths are there to check the arithmetic, not because the index is that precise.
Citing this tool
Last updated . Add the date you accessed it as well, which a citation of a page that can change asks for. If a specific result matters, cite the permalink from the tool’s share row instead of this page: it reproduces the exact parameters.
The equation
Rothfusz (1990), NWS regression on Steadman (1979)
What is the heat index formula?
The heat index (apparent temperature) measures how hot weather feels when relative humidity is factored into ambient air temperature. High humidity impairs the body’s natural cooling by slowing the evaporation of sweat from the skin, and the US National Weather Service calculates the figure with Rothfusz’s regression on Steadman’s apparent temperatures, switching to a simpler formula in mild conditions.
Using the chart
The chart opens on an illustrative humid day: the dew point stays at 24 °C while the air warms from 27 °C at 03:00 to 35 °C at 15:00 and cools again, and the heat index follows it from 30.1 °C, in Caution, to 41.9 °C, in Danger. Touch the chart or any field and the day stops where it is. Drag the point anywhere: across is air temperature and up is relative humidity. Switch on “Hold the dew point” to give the dew point instead, and a drag then slides along its blue curve, the same moisture in warmer or cooler air. “Table” shows the NWS-style grid in °C or °F, every other column of it on a phone, and “Save image” downloads the chart or the whole table at a size that prints.
How the heat index is worked out
The US National Weather Service (NWS) works in °F, with T the air temperature and
RH the relative humidity in percent. It starts with a simple formula,
HI = 0.5 × [T + 61 + (T − 68) × 1.2 + 0.094 RH]. If the simple value is 79 °F or less, it is the
heat index: that is where the NWS’s own online calculator switches, and its equation page puts the switch at
about 80 °F. Otherwise the heat index comes from Rothfusz’s regression, a multiple regression he fitted in 1990 to
Steadman’s 1979 table of apparent temperatures, written here with R for the humidity:
HI = c₁ + c₂T + c₃R + c₄TR + c₅T² + c₆R² + c₇T²R + c₈TR² + c₉T²R²
| Coefficient | Multiplies | Value |
|---|---|---|
| c₁ | 1 | −42.379 |
| c₂ | T | 2.04901523 |
| c₃ | R | 10.14333127 |
| c₄ | TR | −0.22475541 |
| c₅ | T² | −0.00683783 |
| c₆ | R² | −0.05481717 |
| c₇ | T²R | 0.00122874 |
| c₈ | TR² | 0.00085282 |
| c₉ | T²R² | −0.00000199 |
Two adjustments refine the fit at the edges of its range. When the humidity is below 13 percent
and T is between 80 and 112 °F, [(13 − RH)/4] × √[(17 − |T − 95|)/17] is taken off.
When the humidity is above 85 percent and T is between 80 and 87 °F,
[(RH − 85)/10] × [(87 − T)/5] is added. Rothfusz gave his fit an error of ±1.3 °F, about 0.7 °C.
The switch between the two formulas is not smooth. At 100 percent humidity it falls at 76.9 °F, where the simple formula reaches 79.0 °F but the regression gives 77.3 °F, so the heat index drops by 1.7 °F as the air warms past it; at 60 percent it falls at 78.6 °F, and the heat index jumps up by 1.3 °F instead. Isolines on the chart that meet the switch run along it for a while, because that is where the algorithm’s numbers change.
Worked example: 35 °C at 50 percent
-
Convert the temperature:
T = 35 × 9/5 + 32 = 95 °F. The unit converter does this conversion either way for any reading. -
The simple formula:
0.5 × [95 + 61 + (95 − 68) × 1.2 + 0.094 × 50] = 0.5 × 193.1 = 96.55 °F, which is above 79 °F, so the regression runs. -
The regression’s nine terms are −42.379, 194.656, 507.167, −1067.588, −61.711, −137.043, 554.469, 202.545 and
−44.899, which add up to
105.216 °F. - No adjustment applies, since 50 percent is between 13 and 85.
- Convert back:
(105.216 − 32) × 5/9 = 40.7 °C.
So 35 °C at 50 percent humidity feels like 40.7 °C, which is 105.2 °F and in the Danger category, 39.4 to 51.7 °C. The working under the chart does the same for any point, with the numbers put in.
The NWS categories
| Category | Heat index, as the NWS prints it | In °C | Effect on the body, in the NWS’s words |
|---|---|---|---|
| Caution | 80 to 90 °F | 26.7 to 32.2 °C | Fatigue possible with prolonged exposure and/or physical activity |
| Extreme Caution | 90 to 103 °F | 32.2 to 39.4 °C | Heat stroke, heat cramps, or heat exhaustion possible with prolonged exposure and/or physical activity |
| Danger | 103 to 124 °F | 39.4 to 51.1 °C | Heat cramps or heat exhaustion likely, and heat stroke possible with prolonged exposure and/or physical activity |
| Extreme Danger | 125 °F or higher | 51.7 °C or higher | Heat stroke highly likely |
The NWS prints its ranges in whole degrees, so Danger stops at 124 °F and Extreme Danger starts at 125. Here each category runs up to the next one’s edge, so a heat index of 124.5 °F counts as Danger. Below 80 °F the NWS names no category, which is not the same as safe.
Why humidity makes heat worse
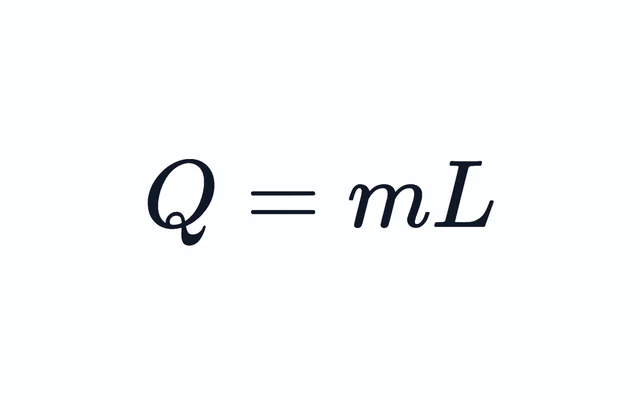
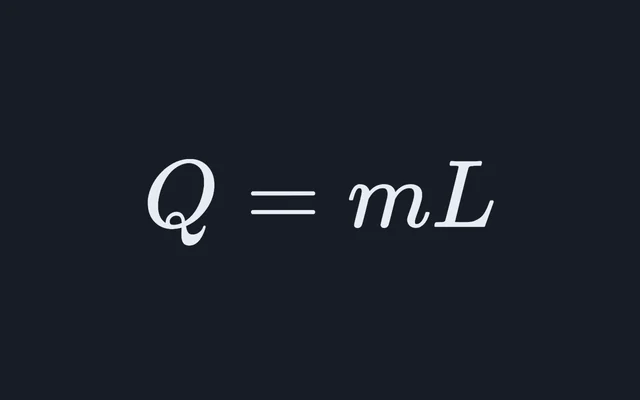
The body makes heat all the time, more when it moves, and has to lose it. When the air is close to skin temperature, about 35 °C, sweating is almost the only way left, and sweat cools only when it evaporates: each gram that evaporates carries off about 2.4 kJ, the latent heat of vaporisation the latent heat calculator works with, while sweat that drips off carries away almost nothing. The wetter the air, the more slowly sweat evaporates, so humid air feels hotter. At 35 °C the heat index is 34.7 °C at 30 percent humidity, 40.7 °C at 50 percent and 50.3 °C at 70 percent.
The wet bulb measures that limit directly: it is the coolest that evaporating water can make anything in the air, wet skin included. At 35 °C it is 21.5 °C at 30 percent and 30.1 °C at 70 percent, which the gauge beside the chart sets against skin at 35 °C. The psychrometric chart explorer works out the wet bulb and the dew point from Hyland and Wexler’s saturation pressure, and this chart uses the same model.
The dew point is the steadier measure of how much water the air holds, since relative humidity falls as air warms with its water unchanged. On the illustrative day the dew point never moves from 24 °C, so the humidity falls from 83.7 percent at 03:00 to 53.0 percent at 15:00, and the heat index still climbs from 30.1 to 41.9 °C. The same saturation pressure, set against the air pressure, is what the boiling point at altitude simulator uses to find where water boils.
Heat index, wet bulb and WBGT are different numbers
They answer different questions, so they should not be read on one scale. The heat index is a feels-like
temperature from a model of a person. The wet-bulb temperature is a physical temperature, the one a thermometer
with a wet wick reads in moving air. The wet-bulb globe temperature, WBGT, used to set limits for sport and
outdoor work, also counts the sun: outdoors it is 0.7 Tnwb + 0.2 Tg + 0.1 Ta, where
Tnwb is a natural wet bulb, Tg the temperature inside a black globe and
Ta the air temperature. At 35 °C and 50 percent the heat index is 40.7 °C and the wet bulb 26.1 °C
at sea level, and a WBGT measured in sunshine would be a third number again.
Where the chart is hatched
Steadman’s table runs from 20 to 50 °C and from dry air to saturated, but in hot, humid air his model of the body has no answer: the sweat it needs would have to evaporate faster than the air can take it. Lu and Romps (2022) worked out where that happens; at 80 percent humidity, for instance, it is above 31 °C, or 88 °F. The NWS formula still gives numbers there, by extrapolating Rothfusz’s fit beyond the data it was fitted to, and Lu and Romps found those numbers run low, by as much as 28 °F (16 °C) on the NWS’s own chart. The hatched corner is that region. Even the NWS’s worked example, 96 °F at 65 percent, giving 121 °F, lies inside it. Lu and Romps extended the index to cover such air; their extended values are not computed here. Beyond the NWS’s chart, in the far corner, the formula climbs so steeply that it overshoots their index instead: at 50 °C and 100 percent it gives 206 °C, against about 152 °C.
This table and the NWS’s printed chart
The table follows the NWS algorithm, adjustments included, and rounds to whole degrees as the NWS chart does. Set beside the NWS’s current printed chart, it differs in a few cells, each for a reason. The printed chart leaves out the humid-air adjustment, so at 80 to 86 °F and 90 percent humidity or more its cells read up to 2 °F lower: it prints 87 °F for 80 °F at 100 percent, where the algorithm gives 89 °F. Two of its cells are also a degree off its own formula: 93 °F for 90 °F at 45 percent, where the formula gives 92.5 °F, and 105 °F for 90 °F at 70 percent, where it gives 105.9 °F. As on that chart, the table leaves its hottest cells empty, every one above 137 °F, the highest number the NWS prints; the printed chart also leaves 92 °F at 95 percent empty, where the formula gives 136.9 °F and the table prints 137. Each cell is coloured by its unrounded value, so a printed 103 can sit either side of the Danger line, and the printed 80 at 40 percent, 79.9 °F, is just short of Caution.
What it leaves out
- Sunshine. The values are for shade. The NWS says full sunshine can add up to 15 °F (8 °C); it is never added in here.
- Wind. Steadman assumed a 5 knot wind. A breeze helps sweat evaporate, but the CDC says that above 90 °F (32 °C) a fan can raise body temperature, and the NWS warns that strong winds in very hot, dry air can be extremely hazardous.
- Clothing and effort. The model person walks at 3.1 mph in long trousers and a short-sleeved shirt. Heavier clothing, protective gear or hard work make the same air more dangerous.
- The person. The model is one adult, 5 ft 7 in tall and 147 pounds. People who are not used to the heat, older people, babies and young children, pregnant women, people with heart, lung or kidney disease and people taking some medicines are at higher risk at any heat index.
- Other countries’ warnings. Many countries issue heat warnings from other indices, such as Canada’s humidex, with thresholds of their own. Follow the local warning; this page is a demonstration of the NWS index, not a safety or medical assessment.
Converting units first? Use the temperature conversion table.
Common questions
How is the heat index calculated?
The US National Weather Service calculates it from the air temperature T in °F and the relative humidity RH in percent. It first works out a simple formula, HI = 0.5 × [T + 61 + (T − 68) × 1.2 + 0.094 RH]. If that comes to 79 °F or less, it is the heat index, as in the NWS’s own online calculator; otherwise it uses Rothfusz’s regression, HI = −42.379 + 2.04901523T + 10.14333127RH − 0.22475541T·RH − 0.00683783T² − 0.05481717RH² + 0.00122874T²RH + 0.00085282T·RH² − 0.00000199T²RH², with a small adjustment in very dry or very humid air. At 95 °F and 50 percent humidity it gives 105.2 °F.
How do you work out the heat index in Celsius?
Convert the temperature to Fahrenheit, F = C × 9/5 + 32, put it through the NWS formula with the humidity, and convert the result back, C = (F − 32) × 5/9. The regression was fitted in Fahrenheit, so converting exactly on the way in and out gives the NWS’s own answer. For 35 °C at 50 percent, 95 °F gives a heat index of 105.2 °F, which is 40.7 °C and in the Danger category, 39.4 to 51.7 °C. The chart and the table here switch between Celsius and Fahrenheit with one button.
What heat index is dangerous?
The NWS has four categories. Caution, 80 to 90 °F (26.7 to 32.2 °C): fatigue is possible with prolonged exposure or activity. Extreme Caution, 90 to 103 °F (32.2 to 39.4 °C): heat cramps, heat exhaustion or heat stroke are possible. Danger, 103 up to 125 °F (39.4 to 51.7 °C): heat cramps or heat exhaustion are likely and heat stroke is possible. Extreme Danger, 125 °F (51.7 °C) or higher: heat stroke is highly likely. The values are for shade, and full sunshine can add up to 15 °F, so a number below a category is never a promise of safety. Local heat warnings are the guide to follow.
Why does humid air feel hotter than dry air at the same temperature?
Because sweat cools the body only when it evaporates, and it evaporates more slowly into air that already holds a lot of water vapour. Each gram that evaporates carries away about 2.4 kJ of heat, but sweat that drips off carries away almost nothing. So the same air temperature feels hotter as the humidity rises: at 35 °C the heat index is 34.7 °C at 30 percent humidity, 40.7 °C at 50 percent and 50.3 °C at 70 percent.
Is the heat index the same as the wet-bulb temperature?
No. The wet-bulb temperature is a physical temperature: the coolest that evaporating water can make anything in that air, which a thermometer with a wet wick reads in moving air. The heat index is a feels-like temperature from a model of a person. They rise together but differ: at 35 °C and 50 percent humidity the heat index is 40.7 °C and the wet bulb 26.1 °C at sea level. The wet-bulb globe temperature, WBGT, used for sport and outdoor work, is a third number again, which also counts the sun.
Does the heat index allow for sunshine and wind?
Only as fixed assumptions. Steadman’s model, which the NWS formula follows, assumes shade and a 5 knot wind, with a person walking at 3.1 mph in long trousers and a short-sleeved shirt. The NWS says full sunshine can raise heat index values by up to 15 °F (8 °C), and that strong winds in very hot, dry air can be extremely hazardous. This chart shows the value for shade and never adds the sunshine in.
Why can the heat index be lower than the air temperature?
Because in dry air sweat evaporates so readily that the air feels cooler than the thermometer says. Steadman’s apparent temperatures are measured against air with a vapour pressure of 1.6 kPa, so drier air than that feels cooler than it is. On the chart a dotted line marks where the heat index equals the air temperature: at 35 °C it crosses at about 32 percent humidity, and at 35 °C and 15 percent the heat index is 32.6 °C.