Blackbody Radiation Simulator
Planck curve, Wien’s peak and Stefan-Boltzmann power from 1,000 to 40,000 K, and the colour each glows: lava, a 2700 K bulb, the Sun and blue stars.
Simulator
Drag the colour strip or the curve’s peak to set the temperature. Arrow keys nudge it 1 percent, Page Up and Page Down 10 percent, and S sweeps. Space plays and pauses.
Named temperatures
Each dot is the colour it glows
Lava and filaments
Lamp and screen ratings
Stars
Beyond the glow
The Sun. The IAU’s nominal effective temperature of the Sun: the temperature of a blackbody that radiates as much per square metre as the Sun does, 62.94 MW/m². It peaks at 502 nm per unit wavelength. Source: IAU 2015 Resolution B3
- Peak wavelength Wien’s law: λmax = b / T = 2.897772 × 10⁻³ m K ÷ 5,772 K = 502 nm, in the green, by the band table the Electromagnetic Spectrum Explorer uses. The peak is not the colour: the Sun peaks in the green and glows white.
- 502 nm
- Power per m² The Stefan-Boltzmann law: M = σT⁴ = 5.670374 × 10⁻⁸ W m⁻² K⁻⁴ × (5,772 K)⁴ = 62.94 MW/m². Doubling T multiplies it by 16.
- 62.94 MW/m²
- Colour CIE 1931 xy (0.327, 0.336), drawn for an sRGB screen whose white is daylight, D65.
- #fff0ea x 0.327, y 0.336
- Visible share ∫πB dλ from 380 to 780 nm = 29.26 MW/m², a Simpson sum at 0.5 nm steps, which is 46.5 percent of σT⁴ = 62.94 MW/m².
- 46.5 %
- Ultraviolet share ∫πB dλ below 380 nm = 6.273 MW/m², by the same Simpson sum: 9.97 percent of σT⁴.
- 9.97 %
- Infrared share From 780 nm to 1 mm, what the other bands leave of σT⁴: 27.4 MW/m², 43.5 percent. Beyond 1 mm the microwaves carry 7.96 × 10⁻⁸ percent.
- 43.5 %
- Luminous efficacy 683 lm/W × ∫V(λ)B dλ ÷ ∫B dλ = 92.1 lm/W, with V(λ) from the CIE 1931 fit, which is weakest in the far red, so it is approximate and rough below 2,000 K. No blackbody does better than about 95 lm/W, near 6,600 K.
- 92.1 lm/W
- Brightness Luminance, 683 ∫V(λ)B dλ, as a multiple of the Sun’s surface at 5,772 K: 1 times. The swatch is always drawn at full brightness, so this is where brightness shows.
- 1 × the Sun
- Peak per frequency νmax = 2.821439 kT / h = 3.393 × 10¹⁴ Hz, which is a wavelength of c / νmax = 883.5 nm. Redder than the peak per wavelength, because equal steps of frequency crowd together at short wavelengths.
- 883.5 nm
A white card in this light
White balance: a camera, or your eyes, rescales red, green and blue until the card looks white again.
Citing this tool
Last updated . Add the date you accessed it as well, which a citation of a page that can change asks for. If a specific result matters, cite the permalink from the tool’s share row instead of this page: it reproduces the exact parameters.
On the syllabus: AP Physics 2, Unit 15: Modern Physics.
The equation
Planck (1900), with Wien (1893), Stefan (1879) and Boltzmann (1884)
What is Planck’s blackbody radiation law?
Planck’s law describes the spectral radiance of electromagnetic radiation emitted by a blackbody in thermal equilibrium at absolute temperature T. As temperature increases, the total power radiated per unit area rises in proportion to T4 (Stefan-Boltzmann law: P/A = σT4), while peak emission wavelength shifts towards shorter wavelengths following Wien’s displacement law: λmax · T = 2.898 × 10⁻³ m·K.
A blackbody is an object that absorbs all the light that falls on it, at every wavelength. Because it absorbs perfectly it also emits perfectly, and the light it gives off depends on nothing but its temperature: not on what it is made of, nor on its shape. Max Planck found the formula for that light in 1900, and it is the curve this simulator draws. A lump of iron, a bulb filament and a star at the same temperature glow with nearly the same colour, apart from how far each falls short of the ideal.
Nothing is exactly a blackbody, but a great deal comes close. The inside of a furnace seen through a small hole is the textbook case. Stars are close, apart from the absorption lines their atmospheres cut into their spectra. Your skin is close in the infrared, where its emissivity is about 0.98. And the cosmic microwave background, the afterglow of the early universe, is a blackbody at 2.72548 K.
Reading the simulator
The first view sweeps the temperature from 1,500 K up to 12,000 K and back. Any touch stops it where it is; the Sweep button starts it again. Then set a temperature in any of these ways:
- Drag along the colour strip at the foot of the scene, which runs from 1,000 to 40,000 K on a log scale, with the stellar classes under it.
- Drag the peak of Planck’s curve sideways. The temperature follows from Wien’s law,
T = b / λmax, so the chart becomes a Wien’s law calculator. - Type a temperature in kelvin, Celsius or Fahrenheit, from 1 K to 100,000 K, or choose one of the named temperatures: lava, lamps, the Sun and other stars, you, and the cosmic microwave background.
- Use the keys on the focused scene: the arrows change the temperature by 1 percent, Page Up and Page Down by 10 percent, and Home and End go to 1,000 and 40,000 K.
The glow in the dark panel is the colour a blackbody at that temperature shows on your screen, with the photons it gives off: a streak in its own colour for each visible photon, a faint ring for infrared, which you feel as warmth but cannot see, a violet ring for ultraviolet, and a wider ring for a microwave, longer than 1 mm, as 91 percent of the cosmic microwave background’s photons are. The chart can switch to log-log axes, from 10 nm to 10 mm, where every peak fits, and below 1,000 K it does so on its own, so the peaks of a body at room temperature and of the cosmic microwave background can be seen.
Planck’s curve and its two peaks
Planck’s law gives the spectral radiance, the power a surface sends out per square metre, per steradian and
per unit of wavelength:
B(λ, T) = (2hc² / λ⁵) × 1 / (e^(hc/λkT) − 1), where h is Planck’s constant, c the speed of light
and k Boltzmann’s constant. At the Sun’s 5,772 K the curve climbs steeply out of the ultraviolet, peaks at
502 nm and falls away slowly through the infrared. That peak per unit wavelength is where Wien’s law puts it.
The same light drawn per unit of frequency peaks somewhere else: at 339 THz, which is a wavelength of 883 nm,
in the infrared. Neither peak is wrong. The two curves cut the same power into different slices: equal steps
of frequency are narrow in wavelength at the blue end and wide at the red end, so the frequency curve’s peak
sits further to the red. The Peak per frequency readout gives it at every temperature, as
νmax = 2.821 kT / h.
So why is the Sun not green? Because the peak is only the top of a very broad curve. Sunlight carries plenty of every visible colour, with 46.5 percent of a 5,772 K blackbody’s power between 380 and 780 nm, and together they look white. Drawn here, a 5,772 K blackbody is #fff0ea, a white with the faintest warmth in it. The Electromagnetic Spectrum Explorer puts that peak on the whole spectrum, from radio waves to gamma rays.
Worked example: Wien’s law
The peak wavelength is Wien’s constant over the temperature in kelvin, λmax = b / T, with
b = 2.898 × 10⁻³ m K.
- The Sun.
2.898 × 10⁻³ ÷ 5,772 = 5.021 × 10⁻⁷ m, which is 502 nm, in the green. - You. First turn 37 °C into kelvin:
37 + 273.15 = 310.15 K. Then2.898 × 10⁻³ ÷ 310.15 = 9.34 × 10⁻⁶ m, which is 9.34 µm, in the thermal infrared. Thermal cameras look at 8 to 14 µm, the band where bodies near room temperature shine brightest and the air lets their light through. - The cosmic microwave background.
2.898 × 10⁻³ ÷ 2.72548 = 1.063 × 10⁻³ m, which is 1.06 mm, in the microwaves.
Both constants are on the Physical Constants page, derived as this simulator derives them: σ and b come from h, c and k, which have been exact since 2019.
Worked example: the Stefan-Boltzmann law
Each square metre of a blackbody radiates M = σT⁴, with
σ = 5.6704 × 10⁻⁸ W m⁻² K⁻⁴, at every wavelength together.
- The Sun’s surface.
5.6704 × 10⁻⁸ × 5,772⁴ = 6.294 × 10⁷ W/m², which is 62.9 MW from every square metre. - The whole Sun. Its surface is
4πR², with the IAU’s nominal radius of 695,700 km, so it radiates6.294 × 10⁷ × 4π × (6.957 × 10⁸)² = 3.83 × 10²⁶ W, the IAU’s nominal solar luminosity of 3.828 × 10²⁶ W. - Twice as hot.
σ(2T)⁴ = 16σT⁴, so doubling the temperature multiplies the power by 16. That fourth power is why a small rise in temperature makes such a difference to the power. - You. A blackbody at 37 °C radiates
5.6704 × 10⁻⁸ × 310.15⁴ = 525 W/m². A room at 20 °C, 293.15 K, radiates 418.8 W/m² back, and with skin’s emissivity of 0.98 the net loss is0.98 × (524.7 − 418.8) = 104 W/m². Bare skin is usually a few degrees cooler than the inside of you, so the real figure is smaller.
Colour temperature in lighting and photography
A lamp’s colour temperature is the temperature of the blackbody whose colour it matches. For a tungsten filament, which glows because it is hot, that is close to the filament’s own temperature, and the CIE’s standard for household tungsten light, illuminant A, is defined as a Planckian radiator at about 2,856 K.
An LED or a fluorescent tube makes its light another way, and its spectrum is nothing like Planck’s curve: a white LED’s is usually a blue peak and a broad yellow hump. So its rating is a correlated colour temperature, the temperature of the blackbody whose colour it is nearest. ANSI C78.377 sorts LED lamps into nominal categories, 2,700, 3,000, 4,000, 5,000 and 6,500 K among them, and lets a lamp in each sit a little above or below the blackbody line, which is why two 3,000 K lamps can look slightly different. 2,700 K and 3,000 K are the warm whites sold for homes, here #ffad58 and #ffb86d; 4,000 K is the trade’s neutral white, #ffd3a5; and 5,000 K and 6,500 K are the cool daylight whites. Gas discharge lamps go further still, with light in a few sharp lines, like the hydrogen lines in the Bohr Model and Hydrogen Spectrum Simulator.
Screens are set to a daylight standard, CIE illuminant D65, whose correlated colour temperature is about 6,504 K. Daylight is not a blackbody: D65 sits 0.0032 above the blackbody line in CIE 1960 uv, towards green. That is why the 6,500 K blackbody here, #fff8fe, is a faint pink beside your screen’s white.
Your eyes adapt to the light around you, and a camera’s white balance does the same job, scaling red, green and blue until a white card is white. A room lit at 2,700 K looks orange in a photograph set for daylight and white once your eyes have adjusted. The two white cards in the simulator show the light both ways. Photographers call 3,200 K tungsten, the light of studio tungsten-halogen lamps and the light tungsten-balanced film is made for.
Star colours and classes
A star’s light is close to a blackbody’s at its surface temperature, so its colour follows its temperature. Betelgeuse, at 3,600 K, peaks at 805 nm, just beyond the red, and looks orange. The Sun peaks in the green and looks white. Rigel, at 12,000 K, peaks in the ultraviolet, at 241 nm, and looks blue-white. Astronomers sort stars into spectral classes by the lines in their spectra, and the lines follow the temperature, so the classes run from cool to hot in this order.
| Class | Colour named | Temperature | Drawn at | Colour here |
|---|---|---|---|---|
| M | Red | 2,400 to 3,700 K | 2,980 K | #ffb76c |
| K | Orange | 3,700 to 5,200 K | 4,386 K | #ffdbb7 |
| G | Yellow | 5,200 to 6,000 K | 5,586 K | #ffeee4 |
| F | Yellow-white | 6,000 to 7,500 K | 6,708 K | #fbf6ff |
| A | White | 7,500 to 10,000 K | 8,660 K | #dae2ff |
| B | Blue-white | 10,000 to 30,000 K | 17,321 K | #afc5ff |
| O | Blue | Above 30,000 K | 40,000 K | #9eb8ff |
The names in the table are tradition: astronomers call the Sun a yellow star, though its blackbody colour is white, and the yellow is partly the sky’s doing, since the atmosphere scatters blue light out of the direct beam.
Why hot bulbs waste energy
At 2,700 K a blackbody puts 8.4 percent of its power into visible light and almost all the rest into infrared. Weighting each wavelength by how sensitive the eye is to it gives the luminous efficacy of the radiation: about 12 lm/W at 2,700 K, against the 683 lm/W of pure green light at 555 nm, the most any light can have. Hotter is better, up to a point. The efficacy climbs to a maximum of about 95 lm/W near 6,600 K and falls beyond it as the light moves into the ultraviolet. A tungsten filament cannot get near that: tungsten melts at 3,422 °C, so filaments run far cooler, and most of what they radiate is heat.
These efficacies use an analytic fit to the CIE’s eye sensitivity, which is weakest in the far red, so below about 2,000 K, where almost all the visible light is deep red, they are rough.
Named temperatures
| Name | Temperature | Peak | Visible share | Colour here | Source |
|---|---|---|---|---|---|
| Kīlauea lava | 1,423 K | 2.04 µm | 0.1 percent | #ff6500 | US National Park Service, Hawaiʻi Volcanoes National Park |
| CIE illuminant A, 2,856 K | 2,856 K | 1.01 µm | 10.5 percent | #ffb363 | CIE 015:2018, standard illuminant A |
| Studio tungsten, 3,200 K | 3,200 K | 906 nm | 15.8 percent | #ffbe7a | Kodak, VISION3 500T technical data: balanced for tungsten at 3200 K |
| Warm white, 2,700 K | 2,700 K | 1.07 µm | 8.37 percent | #ffad58 | ANSI C78.377, nominal colour temperature categories |
| LED, 3,000 K | 3,000 K | 966 nm | 12.7 percent | #ffb86d | ANSI C78.377, nominal colour temperature categories |
| LED, 4,000 K | 4,000 K | 724 nm | 28.6 percent | #ffd3a5 | ANSI C78.377, nominal colour temperature categories |
| LED, 5,000 K | 5,000 K | 580 nm | 41 percent | #ffe6d0 | ANSI C78.377, nominal colour temperature categories |
| LED, 6,500 K | 6,500 K | 446 nm | 48.7 percent | #fff8fe | ANSI C78.377, nominal colour temperature categories |
| Screen white, D65 | 6,504 K | 446 nm | 48.8 percent | #fff8fe | CIE 015:2018, standard illuminant D65 |
| Betelgeuse | 3,600 K | 805 nm | 22.3 percent | #ffca91 | Levesque and Massey (2020), ApJ Letters 891, L37 |
| The Sun | 5,772 K | 502 nm | 46.5 percent | #fff0ea | IAU 2015 Resolution B3 |
| Sirius A | 9,940 K | 292 nm | 40.7 percent | #cddaff | Adelman (2004), IAU Symposium 224, Table 2 |
| Rigel | 12,000 K | 241 nm | 32.6 percent | #c0d1ff | Przybilla et al. (2006), A&A 445, 1099, Table 2 |
| ζ Puppis | 40,000 K | 72.4 nm | 2.58 percent | #9eb8ff | Bouret et al. (2012), A&A 544, A67, Table 3 |
| You, at 37 °C | 310.15 K | 9.34 µm | 5.05 × 10⁻²⁰ percent | No visible glow | Steketee (1973), Phys. Med. Biol. 18, 686, for the emissivity |
| Cosmic microwave background | 2.72548 K | 1.06 mm | 0 percent | No visible glow | Fixsen (2009), ApJ 707, 916 |
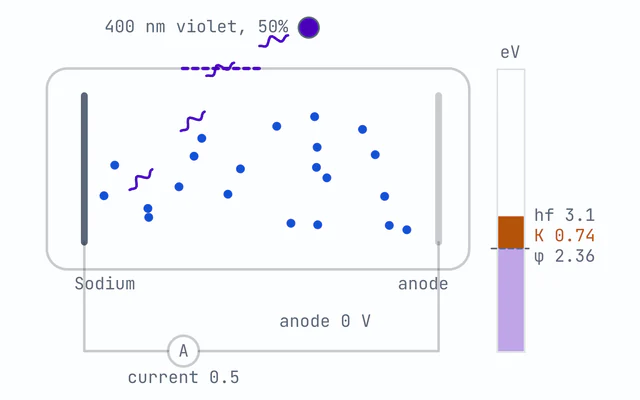
Each photon in these spectra carries an energy E = hc / λ, and the idea that light’s energy comes
in such packets grew out of Planck’s curve. The
Photoelectric Effect Simulator shows where it led, and the
Photon Energy Calculator gives the energy of a photon of any
wavelength.
What the colours on your screen can and cannot show
Every colour here is computed, not chosen. The temperature gives a chromaticity on the Planckian locus, from Krystek’s 1985 rational fit up to 15,000 K and from Planck’s curve summed against an analytic fit to the CIE 1931 colour matching functions above that; the chromaticity becomes XYZ, and XYZ becomes sRGB by the matrix in the W3C’s CSS Color specification, the same one the spectrum explorer’s rainbow uses.
- Below about 1,900 K the true colour is more saturated than any sRGB screen can show, so white is added until it fits, and the swatch is paler than the light itself. The Colour readout says so.
- Brightness is shown apart from colour. Every swatch is drawn at full brightness, since no screen can be as bright as the Sun, so the meter under the sphere shows brightness on a log scale: a 2,700 K surface is 0.0064 times as bright as the Sun’s.
- Below 1,000 K nothing is drawn. Things first glow a dull red, seen only in the dark, near 798 K, the Draper point.
- Your screen changes them. The colours are worked out for an sRGB screen viewed beside daylight. A wide-gamut screen, a night mode or a phone’s colour profile shifts what you see.
Common mistakes
- Leaving Celsius in Wien’s law. Wien’s and Stefan’s laws need kelvin. For a body at 37 °C,
2.898 × 10⁻³ ÷ 37gives 78.3 µm, more than eight times the true 9.34 µm. The field here takes °C and °F and shows the kelvin it uses. - Reading the peak as the colour. The peak is not the colour you see. The Sun peaks in the green and is white; a 4,000 K lamp peaks at 724 nm, in the deep red, and is a neutral white.
- Calling an LED a blackbody. A 3,000 K LED is not at 3,000 K and its spectrum is not Planck’s. Its rating only says which blackbody its colour is closest to.
- Thinking power grows in step with temperature. It grows as the fourth power: a star twice as hot radiates 16 times as much from each square metre.
- Thinking cool things do not radiate. Everything above absolute zero does. You radiate hundreds of watts per square metre, all of it infrared, and a thermal camera sees it.
Model and assumptions
- Method
- Exact expression, no time stepping
- Repeatability
- Every reported number is exact and repeatable. Only the animated scatter is random.
What it assumes
- An ideal blackbody, with emissivity 1 at every wavelength, so its spectrum is Planck’s law and depends on its temperature alone.
- Colours are for the CIE 1931 2 degree observer adapted to daylight, the D65 white of sRGB, shown on an sRGB screen.
- The colour comes from Krystek’s 1985 fit to the Planckian locus from 1,000 to 15,000 K, and above that from Planck’s curve summed against the CIE 1931 fit at 1 nm.
- The ultraviolet and visible shares are Simpson sums of πB at 0.5 nm steps, with the visible band taken as 380 to 780 nm. The microwave share, beyond 1 mm, is the exact series for the power past a wavelength, and infrared, from 780 nm to 1 mm, is what the other three leave.
- The luminous efficacy and the brightness weight the spectrum by the CIE 1931 fit for V(λ), which is weakest in the far red, so both are rough below 2,000 K.
- The photon dots are drawn from the photon-number spectrum by a seeded random number generator, and no number on the page is read from them.
Where it stops holding. Real surfaces emit less than a blackbody at some wavelengths, as tungsten, skin and stars with absorption lines all do. LEDs, fluorescent tubes and gas discharges give line or band spectra instead, so their colour temperature is only that of the nearest blackbody. The Bohr Model and Hydrogen Spectrum Simulator is the right tool there.
Numerical accuracy
No time stepping, so nothing accumulates. The peaks, σT⁴ and every power quoted are closed forms, exact to rounding. Three numbers are approximate by construction. The ultraviolet and visible shares are Simpson sums of πB at 0.5 nm steps, which summed out to 1 mm match σT⁴ to within a part in a million from 1,000 to 40,000 K; the microwave share beyond 1 mm is an exact series, and infrared is what the three leave. The chromaticity is Krystek’s rational fit to the Planckian locus up to 15,000 K, within about 0.0001 in CIE 1960 u and v, and above that a 1 nm sum of Planck’s curve against the analytic CIE 1931 fit. The luminous efficacy and the brightness use the same fit for V(λ), which is weakest in the far red, so both are rough below 2,000 K.
Constants used: Speed of light in vacuum (c), Planck constant (h), Boltzmann constant (k), Stefan-Boltzmann constant (σ) and Wien’s displacement constant (b).
Common questions
What is black body radiation?
The light an ideal object gives off purely because it is hot. Its spectrum depends only on its temperature, by Planck’s law, so a lump of iron, a bulb filament and a star at the same temperature glow with nearly the same colour, apart from how far each falls short of the ideal. The cosmic microwave background, the afterglow of the early universe, is a blackbody at 2.72548 K.
How do you use Wien’s law?
Divide Wien’s constant, 2.898 × 10⁻³ m K, by the temperature in kelvin. The Sun at 5,772 K peaks at 502 nm. A body at 37 °C, which is 310.15 K, peaks at 9.34 µm in the infrared, the band thermal cameras see. The cosmic microwave background, at 2.725 K, peaks at 1.06 mm. Use kelvin, not Celsius: 2.898 × 10⁻³ divided by 37 gives 78.3 µm, more than eight times too long.
How do you calculate radiated power with the Stefan-Boltzmann law?
Each square metre of a blackbody radiates σT⁴, where σ = 5.670 × 10⁻⁸ W m⁻² K⁻⁴. At the Sun’s 5,772 K that is 62.9 MW per square metre. Over a sphere of radius 695,700 km it comes to 3.83 × 10²⁶ W, the IAU’s nominal solar luminosity. Doubling the temperature multiplies the power by 16, and a blackbody at 37 °C radiates 525 W/m², all of it infrared.
What colour are 2700 K, 3000 K, 4000 K and 6500 K light?
2700 K and 3000 K are the warm, orange-tinged whites of household bulbs. 4000 K is the lighting trade’s neutral white, and 6500 K is close to daylight and to a screen’s white. Here a 2,700 K blackbody draws as #ffad58, 3,000 K as #ffb86d, 4,000 K as #ffd3a5 and 6,500 K as #fff8fe. That last is a faint pink beside the screen’s white, because the D65 white that screens use is a daylight that sits slightly off the blackbody curve.
Is an LED’s colour temperature the same as a blackbody’s?
No. A white LED’s spectrum is usually a blue peak and a broad yellow hump, nothing like Planck’s curve, so its rating is a correlated colour temperature: the temperature of the blackbody whose colour it is nearest. The lighting standard ANSI C78.377 lets a nominal 3000 K LED sit slightly above or below the blackbody line, which is why two 3000 K lamps can look a little different.
If the Sun peaks at 502 nm, why isn’t it green?
Because the peak is only the top of a very broad curve. Sunlight has plenty of every visible colour, and together they look white: a 5,772 K blackbody puts 46.5 percent of its power between 380 and 780 nm. Where the peak falls also depends on how the spectrum is plotted: per unit frequency, the Sun peaks at 883 nm, in the infrared.
Why are hot stars blue and cool stars red?
As a star gets hotter its peak moves to shorter wavelengths, so the blue end of its visible light grows faster than the red. Betelgeuse, at about 3,600 K, is orange; the Sun, at 5,772 K, is white; Rigel, at about 12,000 K, is blue-white. Astronomers’ spectral classes run from M, at 2,400 to 3,700 K, to O, above 30,000 K, in OpenStax’s Astronomy 2e.