Flame Test and Emission Spectrum Simulator
Flame test simulation: hold lithium, sodium, potassium, calcium, strontium, barium or copper in a flame, see its colour and split it in a spectroscope.
Simulator
Tap a line or band in the spectrum to read it; the left and right arrow keys step along them. Space plays and pauses.
- Flame colour Computed from the spectrum: its dominant wavelength is 622 nm, chromaticity x = 0.683, y = 0.302. The chip is the nearest colour a screen can show.
- red
- Main emitter Most of the light comes from strontium monohydroxide, which forms in the flame; see the share bar under the scene.
- SrOH molecule
- Brightest band The feature the eye sees most of: SrOH 606 nm, B²Σ⁺ and A²Π → X²Σ⁺. Its light weighted by the eye’s sensitivity outshines every other.
- 606 nm
- Photon energy ΔE = hc/λ with the vacuum wavelength, 606.168 nm. For a band, at its peak.
- 2.045 eV
- Excited at 2200 K The share of strontium atoms in the 5s5p level at any moment, against those in the ground state: N/N₀ = (g/g₀) e^(−E/kT), 2.06 × 10⁻⁶.
- 1 in 490,000
- Through cobalt glass The flame’s spectrum times the glass’s transmission, integrated the same way.
- blue-violet
- Brightness How bright the flame looks against a sodium flame at 2200 K with the same amount of salt, uncompressed and rough: the screen compresses it so that dim flames still show their colour. A salt coloured by molecules is rougher still, resting on one handbook’s flame intensities, so it is given to one figure.
- 0.5 × sodium
Spectrum of strontium chloride
- Flame spectrum
Citing this tool
Last updated . Add the date you accessed it as well, which a citation of a page that can change asks for. If a specific result matters, cite the permalink from the tool’s share row instead of this page: it reproduces the exact parameters.
On the syllabus: AP Chemistry, Unit 3: Properties of Substances and Mixtures; AP Physics 2, Unit 15: Modern Physics; AQA GCSE Required Practicals, Identifying ions; MCAT, 4E: Atoms, nuclear decay, electronic structure, and atomic chemical behavior.
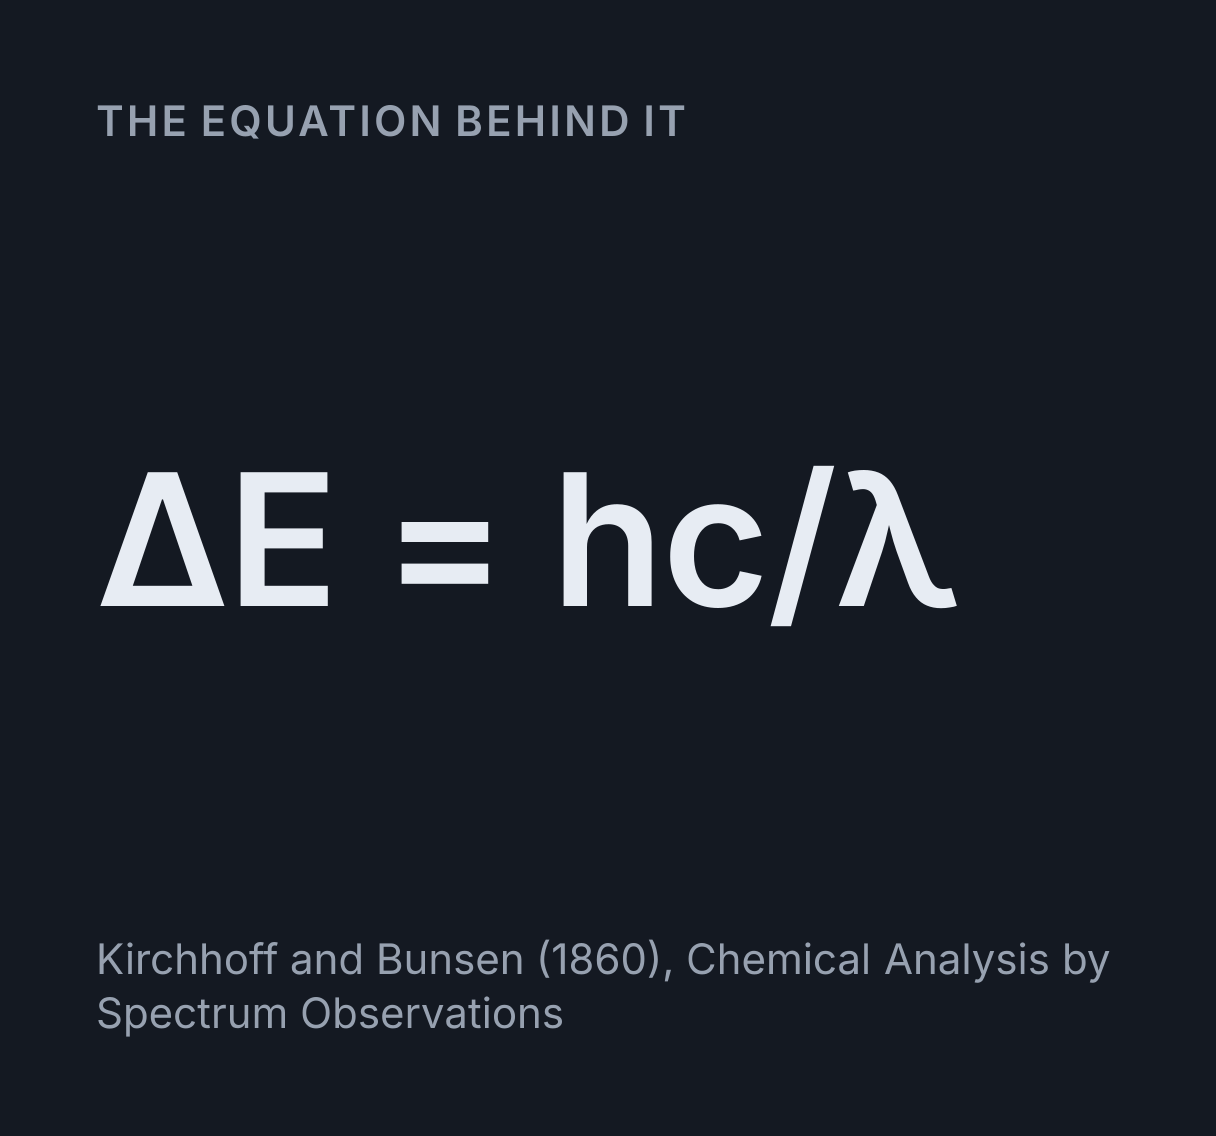
The equation
Kirchhoff and Bunsen (1860), Chemical Analysis by Spectrum Observations
Why do metal ions produce characteristic flame test colours?
In a flame test, the flame breaks a metal salt down into free atoms and small molecules, and collisions in the hot gas lift their electrons into higher energy levels. Each excited electron that drops back gives out a photon whose wavelength matches the energy gap, ΔE = hc / λ. Sodium’s yellow (589 nm) and potassium’s lilac are atomic lines; the colours of calcium, strontium, barium and copper come from molecules such as CaOH, SrOH, BaCl and CuCl that form in the flame.
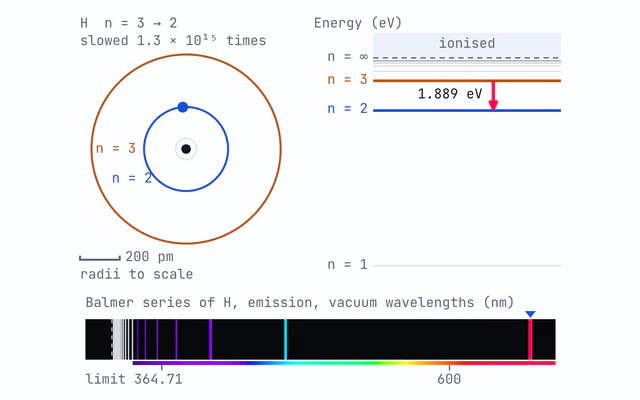
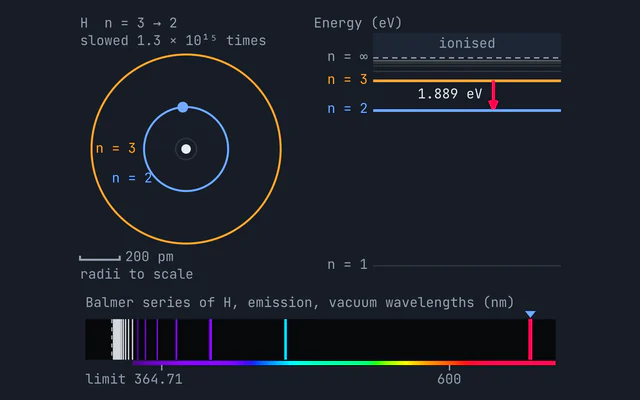
An atom can hold its electrons only in certain energy levels. The gaps between them are fixed by the atom, so its wavelengths are too, and they identify it. It is the rule that gives hydrogen its lines in the Bohr model simulator, applied to atoms with many electrons.
Sodium is the classic case. Its outer electron sits in the 3s level, the configuration [Ne] 3s¹ that
the electron configuration calculator gives,
and the first level above it is 3p, split in two: 3p ²P₃/₂ lies 16,973.366 cm⁻¹ above the ground
state and 3p ²P₁/₂ lies 16,956.170 cm⁻¹ above it. The first gap is
ΔE = hc × 16,973.366 cm⁻¹ = 2.10443 eV, so the photon has
λ = hc/ΔE = 1239.842 eV nm ÷ 2.10443 eV = 589.158 nm in a vacuum, or 588.995 nm in air:
sodium’s D₂ line, at a frequency of 5.09 × 10¹⁴ Hz. The second gap gives the D₁ line, 589.592 nm in
air and 2.1023 eV. The photon energy calculator makes
the same conversion for any wavelength, and the
wavelength and frequency calculator turns a
wavelength into its frequency.
Only a tiny share of the atoms is excited at any moment. At the simulator’s starting temperature,
2200 K, the Boltzmann factor N/N₀ = (g/g₀) e^(−ΔE/kT), summed over both 3p levels, gives
4.5 × 10⁻⁵, about 1 sodium atom in 22,000. The flame still glares yellow, because collisions keep
exciting the atoms and each excited one gives out its photon within about 16 ns, the lifetime of
the 3p level. The share climbs steeply with temperature, from 1 in 3.9 million at 1500 K to 1 in
1,100 at 3000 K. Potassium’s 4p levels lie lower, so at 2200 K about 1 potassium atom in 1,700 is
excited, and lithium’s 2p levels give 1 in 5,700. Knock the outer electron out altogether and it
takes 5.139 eV, sodium’s first ionisation energy, the rightmost peak in the
photoelectron spectroscopy visualiser.
Using the simulator
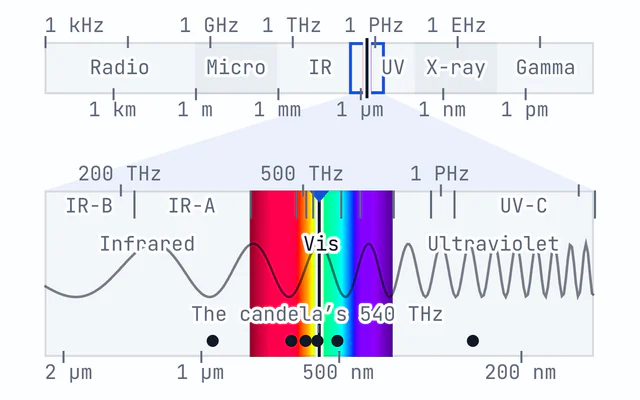
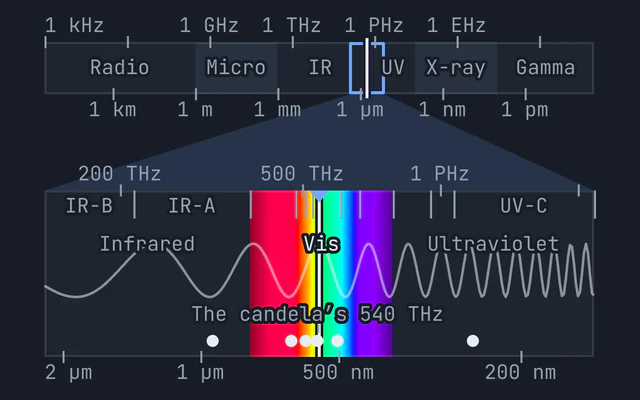
Pick a salt from the dishes under the scene and the loop dips into it and swings back into the flame, which takes the colour computed from that salt’s spectrum. The strip below is the spectroscope, from 380 to 800 nm in air: the visible band and a little of the near infrared, which the electromagnetic spectrum explorer places among the rest. Tap a line or a band in it for its carrier, its wavelength in air, a line’s in a vacuum too, its photon energy and the transition it comes from; the left and right arrow keys step along them. The hand spectroscope draws lines 2 nm wide, and high resolution draws them 0.5 nm wide, which splits sodium’s D lines, 0.597 nm apart, in the magnifier.
- Flame colour names the colour from its dominant wavelength, and the chip beside it is the nearest colour a screen can show.
- Main emitter is the atom or molecule giving most of the light, and Brightest line, or band, is the feature the eye sees most of, with its photon energy.
- Excited is the share of the salt’s atoms in the level its main line comes from, both levels of an alkali’s pair counted, at the flame temperature you set.
- Brightness compares the flame with a sodium flame at 2200 K, uncompressed. The flame on screen is compressed, so that a dim potassium flame still shows its colour. It is rough, and roughest for the salts coloured by molecules, which rest on one handbook’s flame intensities and are given to one figure.
Add a trace of a second salt, hold up the cobalt glass, or switch the strip to absorption. With no link to follow, the simulator opens on seven flames side by side, each with its spectrum under it. The glass, a trace and the temperature change all seven at once; tap one to put it on the bench, and the first tile in the tray brings the row back.
Flame test colours
Each salt’s colour below is the simulator’s, read from its computed spectrum at 2200 K, beside the name school chemistry gives it. AQA’s GCSE specification, for one, lists crimson for lithium, yellow for sodium, lilac for potassium, orange-red for calcium and green for copper.
| Salt | Textbook colour | Simulator | Through cobalt glass | Where the light comes from |
|---|---|---|---|---|
| LiCl lithium chloride | crimson | crimson | purple | Li 670.8 nm, with 610.4 nm weaker |
| NaCl sodium chloride | yellow | yellow | violet | Na 589.0, 589.6 nm |
| KCl potassium chloride | lilac | lilac | lilac | K 766.5, 769.9 nm, with 404.4, 404.7 nm weaker |
| RbCl rubidium chloride | red-violet | violet | violet | Rb 780.0, 794.8 nm, with 420.2, 421.6 nm weaker |
| CsCl caesium chloride | blue-violet | blue-violet | blue-violet | Cs 455.5, 459.3 nm, with stronger lines at 852.1, 894.3 nm in the infrared |
| CaCl₂ calcium chloride | orange-red | orange-red | blue-violet | CaOH 555, 625 nmCaCl 593, 619, 621 nmCa 422.7 nm |
| SrCl₂ strontium chloride | red | red | blue-violet | SrOH 606, 671, 682 nmSrCl 636, 661, 674 nmSr 460.7 nm |
| BaCl₂ barium chloride | green | green | blue-green | BaCl 514, 524, 532 nmBaOH 488, 513, 524 nmBa 553.5 nm |
| CuCl₂ copper(II) chloride | blue-green | blue-green | blue-violet | CuCl 436, 443, 446 nmCuOH 505, 533, 546 nm |
| CuSO₄ copper(II) sulfate | green | green | green | CuOH 505, 533, 546 nm |
| H₃BO₃ boric acid | green | green | blue-green | BO₂ 518, 547, 580 nm |
Only rubidium’s name differs. Its red lines, at 780.0 and 794.8 nm, sit at the very edge of sight, so its colour comes from its violet pair at 420.2 and 421.6 nm, and the simulator calls it violet where books say red-violet. E.-C. Koch’s review of 2002 found the same in fireworks: rubidium and caesium give flames only a whitish pink to violet. Through the simulator’s glass, sodium’s yellow all but vanishes, leaving a faint violet glow of the burner’s own light and the little sodium light that gets through. The reds turn blue-violet or purple, since the glass passes little but violet, blue and deep red, while potassium’s flame stays lilac. Real cobalt glasses vary: A. I. Vogel’s textbook of qualitative analysis, looking through two thicknesses, sees no colour at all from sodium, and reports potassium crimson, calcium light green and strontium purple.
Lines and bands
Atoms give lines. A flame reaches only a handful of an atom’s levels, so its light is a few sharp wavelengths, each as narrow as the spectroscope can show. The alkali metals of group 1 of the periodic table, lithium, sodium, potassium, rubidium and caesium, colour a flame this way.
Molecules give bands. Calcium, strontium and barium from group 2, and copper, form molecules in the flame: monohydroxides such as CaOH from the flame’s own water, and with chloride present, monochlorides such as CaCl. A molecule’s levels are split again by its vibration and rotation, so each electronic jump becomes a band several nanometres wide. James and Sugden showed in 1955 that the alkaline-earth bands come from the monohydroxides, and these bands, not the atoms, give the metals their colours:
- Calcium: CaOH bands near 555 and 625 nm, the 625 nm band the stronger, and CaCl near 593 and 619 nm make its orange-red. The calcium atom’s own line, at 422.7 nm in the violet, gives about 0.3 percent of the light.
- Strontium: SrOH at 606 nm and from 659 to 682 nm, and SrCl from 636 to 674 nm, make its red. The strontium atom adds a blue line at 460.7 nm, again about 0.3 percent of the light.
- Barium: BaCl at 514 and 524 nm and BaOH at 488, 513 and 524 nm make its green, with the barium atom’s line at 553.5 nm.
- Copper: CuCl from about 410 to 460 nm adds blue to the green of CuOH, from about 505 to 550 nm.
- Boron: boric acid gives BO₂, whose bands run from about 470 to 620 nm, strongest at 547 nm.
The band strengths are from the measured flame spectra of Meyerriecks and Kosanke (2003), who sprayed solutions and suspensions of these metals’ salts into a propane flame at about 1900 °C. Boron’s BO₂, which they did not measure, is modelled from its band origin and vibrational frequencies. Measured flame spectra change with the burner, the amount of salt and the anion, so these are typical rather than universal.
Molecules are why copper chloride and copper sulfate differ. With chloride on the loop, copper forms CuCl, whose blue bands turn the flame blue-green; without it, the green bands of CuOH are all there is. In the simulator three fifths of copper chloride’s light comes from CuCl, a share that is a choice, because it depends on how much chloride the loop carries. The temperature slider changes how many atoms are excited, and with it the balance of an atom’s own lines, but the molecular bands keep their measured strengths whatever it says. So in a hotter flame an atom gains on its molecules. Above 2400 K strontium’s 460.7 nm atomic line turns its flame crimson, and above 2700 K lilac; at 3000 K calcium’s flame reads red. Those colours are the model’s, not measurements: a real hotter flame also excites its molecules more and breaks more of them into free atoms, by amounts the measured spectra do not give.
Potassium, sodium and cobalt glass
Potassium’s flame is faint and easily hidden. Its strong lines are a red pair at 766.5 and 769.9 nm, near the end of what the eye can see, and its violet pair at 404.4 and 404.7 nm is far weaker: Meyerriecks and Kosanke measured it at 0.058 against 100 for the 766.5 nm line. In the simulator, which treats both alkalis’ strong pairs as glowing at the black body limit, potassium’s red pair gives out about six times the power of sodium’s yellow, yet looks about 1/3,500 as bright, because the eye is about 20,000 times less sensitive at 766.5 nm than at 589 nm. The burner’s own faint light is about as bright again, so the whole flame looks about 1/1,700 as bright as a sodium flame. Its pale lilac is that red mixed with the violet pair and the burner’s faint blue. The burner’s light is chemiluminescence: the burning itself makes CH and C₂ already excited, rather than the heat exciting them, so the simulator keeps it the same at every temperature. In a cooler flame potassium’s lines fade while the burner’s light does not, and by 1600 K the flames of potassium, rubidium and caesium are all the blue-green of the burner’s inner cone.
So a trace of sodium swamps it. In the simulator 1 percent of sodium already turns a potassium flame orange, and 5 percent turns it yellow. Cobalt blue glass is the fix: it absorbs almost everything from about 525 to 680 nm, letting through about 1 part in 11,000 of sodium’s 589 nm light, while passing violet, blue and deep red, 92 percent at 404 nm and at 766 nm in the simulator. Through the glass the yellow is gone and potassium shows lilac again, whatever the sodium. Set the trace to 10 percent sodium and hold up the glass to see it.
Emission and absorption spectra
A hot vapour gives an emission spectrum, bright lines on a dark background. Shine white light through the same atoms while they are cool and they take light out at the same wavelengths, an absorption spectrum of dark lines on a rainbow. Switch the spectroscope to absorption to see it.
Only lines that end on the ground level appear, because a cool vapour has almost no atoms in excited levels to absorb from. Sodium’s D lines, potassium’s four lines and the single lines of calcium, strontium and barium all end on the ground level and go dark. Lithium’s 610.4 nm line ends on its 2p level and does not, and copper shows no visible absorption lines at all, since every visible copper line ends on an excited level. The simulator darkens each line by its oscillator strength: the strong lines go fully dark, and potassium’s violet lines take out about two thirds and two fifths of the light. Molecular bands are left out of the absorption view.
This is how sunlight shows sodium. The dark D lines at 589 nm, which Fraunhofer labelled D, are sodium atoms in the Sun’s outer layers absorbing, and Kirchhoff showed in 1859 that a sodium flame in the path of sunlight darkens them further. With Bunsen and their flame spectroscope he went on to find two new elements by their lines: caesium in 1860, from two blue lines at 455.5 and 459.3 nm, and rubidium in 1861, from its red lines, named from the Latin caesius, sky blue, and rubidus, deep red.
Telling red flames apart: lithium against strontium
Lithium’s crimson and strontium’s red look alike, and calcium’s orange-red is not far off. The spectroscope separates them at once, by the shape of the light rather than where it is. Lithium gives one sharp line at 670.8 nm, really two lines 0.015 nm apart, with a faint orange line at 610.4 nm that in the simulator carries about a thousandth of the power but, the eye being far more sensitive there, 1.5 percent of what it sees. Strontium gives broad bands from about 600 to 710 nm, from SrOH and SrCl, with a sharp blue line from the strontium atom at 460.7 nm.
Both put light near 671 nm: SrOH has a band there, 13 nm wide, where lithium has its line, so it is the sharpness that tells them apart. Calcium’s bands sit further towards the yellow, at 555, 593 and 625 nm, and calcium adds a violet line at 422.7 nm.
What a flame test cannot tell you
A flame test screens rather than proves. Several ions give similar colours, the reds of lithium, strontium and calcium and the greens of barium, copper and boron, so a colour on its own is a clue to confirm with another test or a spectroscope. Mixtures mask each other: sodium, the commonest contaminant, hides potassium, and a strong emitter hides a weak one. Many metal ions give no colour at all; magnesium and aluminium ions, for example, leave the flame unchanged. And the test says nothing reliable about how much of an ion there is. A flame photometer, which measures the brightness of one element’s light through a filter against standards of known concentration, turns it into a measurement.
Safety
Barium and copper compounds are toxic, and a lit burner is a hazard. Flame tests belong in a laboratory, with eye protection and as your teacher or your lab’s rules direct. Do not try this at home.
Common mistakes
- Using a dirty loop. Sodium is everywhere, on fingers and in dust, so a wire that is not cleaned between salts gives a yellow flame whatever is on it. Clean it as your lab directs, usually by dipping it in hydrochloric acid and heating it until the flame shows no colour.
- Judging potassium without the glass. A yellow flame may be sodium hiding potassium, so look again through cobalt glass.
- Reading the colour from the wrong flame. With the burner’s air hole closed the flame glows yellow from hot soot and hides the salt; open it for a blue flame, and read the colour from the outer flame, not the inner cone, which is the burner’s own blue-green.
- Expecting a metal’s strongest atomic line to set its colour. Calcium’s strongest line is violet, at 422.7 nm, yet its flame is orange-red, because the light comes from CaOH and CaCl.
- Expecting two red flames to differ in where their light is. Lithium and strontium both put light near 671 nm, one as a sharp line and the other as a broad band.
- Mixing air and vacuum wavelengths. Tables of lines give wavelengths in air, about 0.03 percent shorter than in a vacuum. A photon’s energy comes from its vacuum wavelength, which is why the simulator converts each one first, by the formula of Peck and Reeder (1972) for standard air at 15 °C and 101,325 Pa.
What this simulator leaves out
It holds the amount of salt fixed. In a real flame, as the salt grows more concentrated, the strongest lines absorb their own light and stop growing, so doubling the salt does not double the yellow. It leaves out ionisation: in a hotter flame potassium, rubidium and caesium lose their outer electrons and their lines weaken, which the Boltzmann readout does not include. It treats the flame as one temperature, where a real burner’s temperature and chemistry change from the inner cone to the tip, and it leaves out the faint continuous glow of hot particles. The flame’s shape and flicker are drawn, not computed; only its colour and brightness come from the spectrum. Its constants, the Planck constant and the Boltzmann constant among them, take their exact values in the SI.
Model and assumptions
- Method
- Exact expression, no time stepping
- Repeatability
- Deterministic. The same link gives the same numbers on any machine.
What it assumes
- Each salt’s light is a fixed list of atomic lines and molecular bands, with positions and strengths from cited flame spectra, so it is typical of a gas flame rather than of any one burner or loading.
- Atomic wavelengths, levels, degeneracies and transition probabilities are NIST Atomic Spectra Database values, the wavelengths in standard air, and each photon’s energy comes from its vacuum wavelength by the formula of Peck and Reeder (1972).
- The bands of calcium, strontium, barium and copper are Gaussians fitted to the measured flame spectra of Meyerriecks and Kosanke (2003), while boron’s BO₂ bands are modelled from their band origin and vibrational frequencies.
- An alkali’s strong resonance pair glows at the black body limit for the flame’s temperature, and its weaker lines follow the Boltzmann factor, scaled once to potassium’s measured violet-to-red ratio.
- A molecular salt’s bands keep their measured strengths at every temperature, scaled to its output against sodium from the CRC Handbook’s flame intensities, with boric acid, which has none, given copper’s; only its atom’s own line follows the Boltzmann factor.
- The colour is the CIE 1931 two-degree integral of the spectrum, converted to sRGB with white added until no channel is negative.
- Cobalt glass is three absorption bands of tetrahedral cobalt(II) fitted to the shape of a measured blue glass, at a depth chosen to let about a ten-thousandth of sodium’s 589 nm light through, so it stands for no one maker’s glass, and the cool vapour in the absorption view holds only atoms in their ground state.
- The burner’s own light, CH and the C₂ Swan bands of its inner cone, is added to every flame at a chosen strength, about as bright to the eye as potassium’s own light at 2200 K, so it is half of what a potassium flame shows and outweighs the dimmer alkalis in a cooler flame.
- Brightness on screen is compressed so that dim flames stay visible, and the flame’s shape and flicker are drawn rather than computed.
Where it stops holding. Concentrated salts, whose strongest lines absorb their own light and stop growing with concentration; hot flames, where potassium, rubidium and caesium ionise and their lines weaken; any flame far from the measured one, about 2200 K, where the molecular bands, held at their strengths there, would change as the molecules’ upper levels fill or empty and more or fewer of them break into atoms; and real burners, whose temperature and chemistry change from the inner cone to the tip.
Numerical accuracy
No time stepping, so nothing accumulates: every wavelength, photon energy, Boltzmann share and transmission is a closed form, exact to rounding. Three things are approximate by construction. The spectrum is a sum of Gaussian profiles put into 1 nm bins from 380 to 830 nm, each profile integrated across each bin, so each colour is the CIE integral done as a 1 nm sum. The colour matching values beyond 650 nm and below 420 nm are analytic tails joined to the site’s fitted curves rather than the CIE table, within 9 percent of the table beyond 650 nm and 25 percent below 420 nm. And the brightness on screen is compressed as (Y/Y_ref)^0.4, so a flame drawn twice as bright is about 5.7 times as bright in the model; the Brightness readout gives the uncompressed ratio.
Constants used: Speed of light in vacuum (c), Planck constant (h) and Boltzmann constant (k).
Common questions
Why do different metals give different flame colours?
The flame’s heat lifts electrons into higher energy levels, and when they fall back each atom gives out light with energies set by its own levels, ΔE = hc/λ. Sodium’s two 3p levels lie 2.104 and 2.102 eV above its ground state, which gives light at 589.0 and 589.6 nm in air. At 2200 K only about 1 sodium atom in 22,000 is excited at any moment, yet that is enough to colour the flame yellow. Calcium, strontium, barium and copper colour flames mostly through molecules that form in the flame, such as CaOH, which have levels of their own.
Why is potassium’s flame lilac, and why use cobalt blue glass?
Potassium gives deep red lines at 766.5 and 769.9 nm, near the end of what the eye can see, and far weaker violet ones at 404.4 and 404.7 nm, so its flame is pale: in the simulator about 1/1,700 as bright as sodium’s, its lilac that red mixed with the violet and the burner’s own faint blue. A trace of sodium hides it, and in the simulator 1 percent turns the flame orange. Cobalt glass absorbs sodium’s yellow but passes violet and deep red, so potassium’s lilac shows through it: the simulator’s glass lets through only about 1 part in 11,000 of sodium’s 589 nm yellow.
Why is a calcium flame orange-red when calcium’s strongest line is violet?
Most of the light comes from molecules that form in the flame: CaOH, with bands near 555 and 625 nm, and CaCl, near 593 and 619 nm. The calcium atom’s own line at 422.7 nm gives only about 0.3 percent of the light in a gas flame. Strontium, barium and copper also colour flames mainly through molecules: SrOH and SrCl, BaCl and BaOH, and CuCl and CuOH.
How can you tell a lithium flame from a strontium flame?
Both look red, but a spectroscope separates them at once. Lithium gives one sharp line at 670.8 nm, with a faint orange one at 610.4 nm, while strontium gives broad bands from about 600 to 710 nm, from SrOH and SrCl, and a sharp blue atomic line at 460.7 nm. Both put light near 671 nm, so it is the sharpness of lithium’s line, not where it is, that tells them apart.
What is the difference between an emission and an absorption spectrum?
A hot vapour gives bright lines on a dark background; the same atoms, cool, in front of a white light take out light at the same wavelengths as dark lines. Only lines that end on the ground level show in absorption, because a cool vapour has almost no atoms in excited levels, so lithium’s 610.4 nm line never appears dark. The dark D lines at 589 nm in sunlight are sodium in the Sun’s outer layers absorbing.
Why is copper chloride’s flame blue-green but copper sulfate’s green?
With chloride present, copper forms CuCl in the flame, whose bands from about 410 to 460 nm add blue. Without chloride, the green bands of CuOH, from about 505 to 550 nm, are all there is. The anion changes which molecules form in the flame, and so the colour: in the simulator three fifths of copper chloride’s light comes from CuCl, a share that depends on how much chloride the loop carries.
How were caesium and rubidium discovered?
By Robert Bunsen and Gustav Kirchhoff with their flame spectroscope: caesium in 1860, from two blue lines at 455.5 and 459.3 nm, and rubidium in 1861, from its deep red lines at 780.0 and 794.8 nm. The names, from the Latin caesius, sky blue, and rubidus, deep red, describe those lines rather than the flames: in the simulator caesium’s flame is blue-violet and rubidium’s violet.