Electromagnetic Spectrum Explorer
The electromagnetic spectrum runs from radio waves to gamma rays. Pick any point to see its wavelength, frequency, photon energy, band, sources and uses.
Visualiser
Drag or tap either strip to choose a point. The left and right arrow keys nudge it, up and down jump a band, and Page Up and Page Down move a factor of ten.
- Band 380 to 780 nm here. The CIE says the limits are not exact: the lower one lies between 360 and 400 nm and the upper between 760 and 830 nm.
- Visible light
- Sub-band Colour names are approximate and not standardised. The CIE’s UV-A runs up to 400 nm, into the violet.
- Green
- Wavelength In a vacuum. In glass or water it is shorter by the refractive index, while the frequency stays the same.
- 550 nm
- Frequency Set by the source, and unchanged when the wave enters a new material.
- 545.1 THz
- Photon energy E = hf, the same for every photon of this frequency however bright the beam.
- 2.254 eV
- Energy in joules One electronvolt is exactly 1.602176634 × 10⁻¹⁹ J.
- 3.612 × 10⁻¹⁹ J
- Per mole A mole of these photons, to compare with bond energies: a carbon to carbon single bond is about 350 kJ/mol.
- 217.5 kJ/mol
Visible light
- Wavelength
- 380 to 780 nm
- Frequency
- 384 to 789 THz
- Photon energy
- 1.59 to 3.26 eV
380 to 780 nm here. The CIE says the limits are not exact: the lower one lies between 360 and 400 nm and the upper between 760 and 830 nm.
Produced by
- The Sun and other stars
- Hot filaments and flames
- LEDs and lasers
- Atoms dropping to lower energy levels, as in neon and sodium lamps
Used for
- Sight, which is what makes this band visible
- Photosynthesis
- Photography and light microscopes
- Spectroscopy, which reads atoms and molecules from the colours they absorb or emit
Examples in this band
Citing this tool
Last updated . Add the date you accessed it as well, which a citation of a page that can change asks for. If a specific result matters, cite the permalink from the tool’s share row instead of this page: it reproduces the exact parameters.
The equation
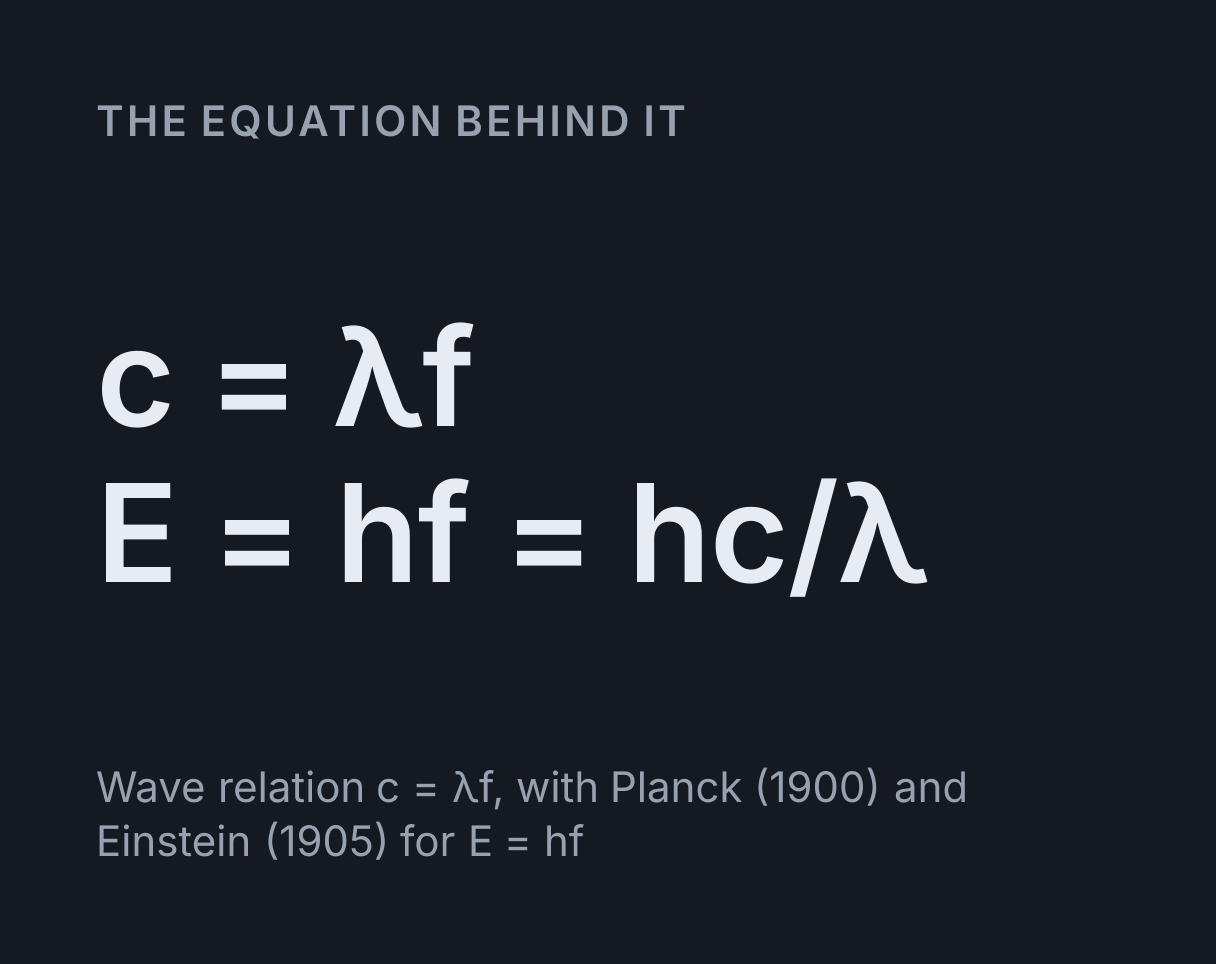
Wave relation c = λf, with Planck (1900) and Einstein (1905) for E = hf
What the electromagnetic spectrum is
The electromagnetic spectrum is the whole range of electromagnetic radiation, ordered by
frequency: radio waves, microwaves, infrared, visible light, ultraviolet, X-rays and gamma
rays. They are one kind of wave at different frequencies, not seven different things. All of
them travel through a vacuum at the same speed, c = 299,792,458 m/s, so
wavelength and frequency are locked together by c = λf, and each photon carries
an energy E = hf = hc/λ.
Moving right along the explorer raises the frequency and the photon energy and shortens the wavelength, all at once. The range drawn runs from 1 kHz to 10²³ Hz, wavelengths from about 300 km down to 3 fm: twenty powers of ten on one axis. The strip at the top keeps all of it in view, and the lens below magnifies the 1.2 powers of ten around the marker, which is where the finer divisions, the colours of visible light and the named examples appear.
Reading the explorer
Drag or tap along either strip, type a value, or step through the bands with the buttons under the scene. A value can be typed in any unit: a length sets the wavelength, hertz the frequency, and electronvolts or joules the photon energy, and the other two follow. The readouts give:
- Band, one of the seven, from the edges in the table below.
- Sub-band, the finer name: the ITU’s numbered radio bands, the CIE’s UV-A, UV-B and UV-C or IR-A, IR-B and IR-C, or a colour inside the visible.
- Wavelength, frequency and photon energy, each in the unit that suits its size, so a radio wave reads in metres and a gamma ray in picometres.
- Per mole, the energy of a mole of photons, the figure to set against bond energies, since those are quoted per mole.
The wave drawn through the lens has its crests spaced in proportion to the wavelength, so it tightens towards the right as the wavelength shortens. Only that ratio is to scale: across the lens the spacing changes about sixteenfold. The panel under the scene says what produces the band, what it is used for, and which named examples fall inside it, and each example gives the source of its figure.
The seven bands and where their edges come from
| Band | Wavelength | Frequency | Photon energy | Edges from |
|---|---|---|---|---|
| Radio waves | Longer than about 1 m | Below 300 MHz | Below 1.24 µeV | ITU band 8 and below |
| Microwaves | About 1 mm to 1 m | 300 MHz to 300 GHz | 1.24 µeV to 1.24 meV | OSHA, and ITU bands 9 to 11 |
| Infrared | 780 nm to about 1 mm | 300 GHz to 384 THz | 1.24 meV to 1.59 eV | CIE, 780 nm to 1 mm |
| Visible light | 380 to 780 nm | 384 to 789 THz | 1.59 to 3.26 eV | Inside the CIE’s limits |
| Ultraviolet | 10 to 380 nm | 789 THz to 30.0 PHz | 3.26 to 124 eV | CIE divides 100 to 400 nm |
| X-rays | 10 pm to 10 nm | 30.0 PHz to 30.0 EHz | 124 eV to 124 keV | Convention |
| Gamma rays | Shorter than 10 pm | Above 30.0 EHz | Above 124 keV | Convention, though named by source |
Nothing physical happens at any of these edges. The spectrum is continuous, so every boundary is an agreement, and different fields agree on different ones.
- Microwaves are 300 MHz to 300 GHz, the definition the US Occupational Safety and Health Administration uses and exactly bands 9 to 11 of the ITU’s nomenclature in Recommendation ITU-R V.431-8. The ITU’s Radio Regulations count everything below 3000 GHz as radio, so microwaves are the top of the radio range rather than a separate kind of wave.
- Visible light is 380 to 780 nm. The International Commission on Illumination (CIE) says there are no exact limits, and puts the lower one between 360 and 400 nm and the upper between 760 and 830 nm. NASA’s educational pages use 380 to 700 nm.
- Infrared starts at 780 nm, where the CIE’s IR-A begins, and runs to 300 GHz, which is 0.9993 mm: the CIE’s 1 mm to within 0.07 percent.
- Ultraviolet, X-rays and gamma rays are divided at 10 nm and 10 pm by common convention, and other sources draw both lines elsewhere. The CIE’s UV-A, UV-B and UV-C cover 100 to 400 nm.
The same table names the region on the Wavelength and Frequency Calculator and the Photon Energy Calculator, so every page of this site names a wavelength from the same edges.
Worked example: a microwave oven
A microwave oven runs at 2.45 GHz. What are its wavelength and its photon energy?
-
Wavelength:
λ = c / f = 299792458 / 2.45e9 = 0.1224 m, which is 12.24 cm. - Energy:
E = hf = 6.62607015e-34 × 2.45e9 = 1.623e-24 J. -
In electronvolts:
1.623e-24 / 1.602176634e-19 = 1.013e-5 eV, which is 10.13 µeV. -
Per mole:
E × N_A = 6.62607015e-34 × 2.45e9 × 6.02214076e23 = 0.9776 J/mol, which the explorer shows as 0.0009776 kJ/mol.
That photon is about 360,000 times too weak to break a carbon to carbon single bond, at
around 350 kJ/mol, and about 2,500 times smaller than the thermal energy kT of a
molecule at 20 °C. So a microwave oven cannot break bonds or ionise anything: each photon
carries far too little. Its field oscillates 2.45 billion times a second, and the water
molecules it keeps turning back and forth pass that energy on to the food as heat.
At the other end of the scale, the gamma ray from technetium-99m, the isotope gamma cameras image in nuclear medicine, carries 140.5 keV: a wavelength of 8.824 pm and a frequency of 33.98 EHz, about 14 billion times the energy of the oven’s photon. Type 2.45 GHz or 140.511 keV into the explorer to check the figures.
Named examples on the spectrum
| Example | Wavelength | Frequency | Photon energy | Band | Source |
|---|---|---|---|---|---|
| MRI at 1.5 T | 4.694 m | 63.86 MHz | 264.1 neV | Radio waves | CODATA 2022, shielded proton gyromagnetic ratio |
| FM radio | 2.998 m | 100 MHz | 413.6 neV | Radio waves | ITU-R V.431-8, Table 3 |
| Hydrogen 21 cm line | 21.11 cm | 1.42 GHz | 5.874 µeV | Microwaves | ITU-R RA.314-11 |
| Microwave oven | 12.24 cm | 2.45 GHz | 10.13 µeV | Microwaves | 47 CFR 18.301 |
| Cosmic microwave background | 1.063 mm | 282 GHz | 1.166 meV | Microwaves | Fixsen (2009), with Wien’s displacement law |
| Body at 37 °C | 9.343 µm | 32.09 THz | 132.7 meV | Infrared | Wien’s displacement law |
| TV remote | 940 nm | 318.9 THz | 1.319 eV | Infrared | NASA Science, Infrared Waves |
| Helium-neon laser | 633 nm | 473.6 THz | 1.959 eV | Visible light | NIST Atomic Spectra Database, Ne I |
| Sodium D line | 589 nm | 509 THz | 2.105 eV | Visible light | NIST Atomic Spectra Database, Na I |
| The candela’s 540 THz | 555.2 nm | 540 THz | 2.233 eV | Visible light | SI Brochure, definition of the candela |
| Sunlight’s peak | 502 nm | 597.1 THz | 2.47 eV | Visible light | IAU 2015 Resolution B3, with Wien’s displacement law |
| Germicidal lamp | 254 nm | 1.18 PHz | 4.881 eV | Ultraviolet | NIST Atomic Spectra Database, Hg I |
| Hydrogen Lyman-alpha | 121.6 nm | 2.466 PHz | 10.2 eV | Ultraviolet | NIST Atomic Spectra Database, H I |
| Copper K-alpha X-rays | 154.1 pm | 1.946 EHz | 8.048 keV | X-rays | NIST X-ray Transition Energies |
| Iron-57 gamma ray | 86.02 pm | 3.485 EHz | 14.41 keV | X-rays | IAEA LiveChart of Nuclides (ENSDF) |
| Molybdenum K-alpha X-rays | 70.93 pm | 4.226 EHz | 17.48 keV | X-rays | NIST X-ray Transition Energies |
| Technetium-99m | 8.824 pm | 33.98 EHz | 140.5 keV | Gamma rays | IAEA LiveChart of Nuclides (ENSDF) |
| Positron annihilation | 2.426 pm | 123.6 EHz | 511 keV | Gamma rays | CODATA 2022, electron mass energy equivalent |
| Caesium-137 | 1.874 pm | 160 EHz | 661.7 keV | Gamma rays | IAEA LiveChart of Nuclides (ENSDF) |
| Cobalt-60 | 930.5 fm | 322.2 EHz | 1.332 MeV | Gamma rays | IAEA LiveChart of Nuclides (ENSDF) |
Why X-rays and gamma rays overlap
In most of physics the two names describe where a photon comes from, not how short its wavelength is. X-rays come from electrons, whether dropping between the inner energy levels of an atom, braking sharply in a metal target or bending in the magnets of a synchrotron. Gamma rays come from atomic nuclei, and from particle processes such as a positron annihilating with an electron. Those sources overlap in energy.
The 14.41 keV gamma ray from an iron-57 nucleus, the line Mössbauer spectroscopy uses, has a wavelength of 86.02 pm. The 17.48 keV X-ray from a molybdenum target has more energy and a shorter wavelength, 70.93 pm. To draw one scale the explorer follows the common convention of calling everything shorter than 10 pm a gamma ray, and its Sub-band readout says “Named by its source” across both bands as a reminder.
Astronomy is the exception. Astronomers often cannot know how a photon was made, and they choose their detectors by its energy, so they name the two by energy. That is why the flashes that thunderstorms send into space are called gamma rays, although fast electrons produce them.
Why visible light is such a thin slice
Visible light runs from 380 to 780 nm, a factor of about 2.05, which is roughly a third of one power of ten out of the twenty drawn.
Its colours are computed rather than painted. Each wavelength’s CIE 1931 colour matching values, from the analytic fit Wyman, Sloan and Shirley published in 2013, are converted to the sRGB colours a screen can show with the matrix in the W3C’s CSS Color specification. Every pure spectral colour lies outside what sRGB can show, so each is drawn as the nearest sRGB colour of the same hue, with some white added. Beyond 420 nm at one end and 650 nm at the other the hue of spectral light barely changes, so the strip holds those hues and darkens towards 380 and 780 nm instead, to show vision fading out rather than stopping. The Double-Slit Simulator shows how interference measures these wavelengths.
Ionising and non-ionising radiation
With ordinary light, whether a photon can knock an electron out of an atom depends on the photon’s energy and the atom, not on how many photons arrive. A hydrogen atom needs 13.6 eV, a wavelength of 91.2 nm or less, and a water molecule 12.6 eV, 98.2 nm or less. UV-A and UV-B photons carry 3.1 to 4.4 eV, so they can ionise neither. They harm skin chemically instead: DNA absorbs UV-B, and two neighbouring thymine or cytosine bases on the same strand bond together. X-rays and gamma rays, from 124 eV upwards, ionise the atoms that absorb them.
Brightness changes none of this. A brighter source sends more photons, each with the same energy, which is why a dim ultraviolet lamp can cause sunburn that a bright red lamp cannot, and why the Photon Energy Calculator needs only a wavelength.
What this explorer leaves out
- Brightness. It describes a single photon. How many photons there are,
which is what intensity measures, never enters
E = hf. - Materials. Every wavelength here is a vacuum wavelength. In glass or water light slows by the refractive index and its wavelength shortens in step, while its frequency, photon energy and band stay the same. The Wavelength and Frequency Calculator takes any wave speed, and the Refractive Index Table lists the indices.
- The atmosphere. It does not show which bands reach the ground. NASA notes that the atmosphere absorbs almost all of the Sun’s UV-C and about 95 percent of its UV-B.
- Exact edges. The edges are the conventions set out above. Other sources place them elsewhere, especially between ultraviolet, X-rays and gamma rays.
- Exact colours. The strip is the nearest a screen can show, not the colours themselves, and its fading ends are a display choice.
- Anything outside 1 kHz to 10²³ Hz. The 50 Hz of mains electricity and the gigaelectronvolt gamma rays that space telescopes record are electromagnetic too, beyond the ends drawn here.
Common mistakes
- Picturing infrared as red and ultraviolet as violet. Infrared is not red light and ultraviolet is not violet light. The names only say which side of the visible band they sit on, which is why both are drawn in grey.
- Thinking a radio wave is a sound wave. A radio carries sound as a signal,
but the wave itself is electromagnetic and travels at
c, while sound is a pressure wave that travels at about 343 m/s in air. - Treating microwaves as something other than radio. They are the top of the radio range, split off because the technology changes, not the physics.
- Thinking every gamma ray carries more energy than every X-ray. Outside astronomy the names follow the source, and the energies overlap: the iron-57 gamma ray above is weaker than the molybdenum X-ray.
- Calling all ultraviolet ionising. Only the shortest wavelengths are. Sunburn comes from UV-B, which cannot ionise.
- Expecting round numbers to agree in every unit. 300 GHz is 0.9993 mm, not
1 mm, because
cis 2.998 × 10⁸ m/s rather than 3 × 10⁸. A table that quotes both has rounded one of them.
Common questions
What is the order of the electromagnetic spectrum?
From the longest wavelength to the shortest: radio waves, microwaves, infrared, visible light, ultraviolet, X-rays and gamma rays. Frequency and photon energy rise in exactly the same order, because every part of the spectrum travels at the speed of light in a vacuum, so a shorter wave has to oscillate faster, and E = hf makes each photon’s energy proportional to that frequency. Across the range drawn here the wavelength shrinks from about 300 km to 3 fm, twenty powers of ten, and visible light is the narrow slice from 380 to 780 nm.
Where does one band of the spectrum end and the next begin?
Wherever a convention puts it, because the spectrum is continuous and nothing physical changes at an edge. This explorer takes microwaves as 300 MHz to 300 GHz, the definition the US Occupational Safety and Health Administration uses and exactly the ITU’s bands 9 to 11. It puts visible light at 380 to 780 nm, inside the ranges the International Commission on Illumination gives for each limit, and starts infrared at 780 nm as that commission does. The edges between ultraviolet, X-rays and gamma rays, at 10 nm and 10 pm, are common conventions, and other sources place them elsewhere.
Are microwaves a kind of radio wave?
Yes. The ITU’s Radio Regulations define radio waves as electromagnetic waves below 3000 GHz, which takes in every microwave, so microwaves are the high-frequency end of radio rather than a separate kind of wave. They are usually listed on their own because the technology changes, not the physics: between about a metre and a millimetre, waves are carried in metal waveguides and focused by dishes. A microwave oven at 2450 MHz heats food because the food absorbs the waves, which set its water molecules moving.
What is the difference between X-rays and gamma rays?
Where they come from, not their wavelength. Gamma rays are emitted by atomic nuclei, and X-rays by electrons, for example dropping between the inner energy levels of an atom or slowing sharply in a metal target, so the two overlap in energy. The 14.4 keV gamma ray from an iron-57 nucleus has a longer wavelength than the 17.5 keV X-ray from a molybdenum target. Astronomy is the exception: astronomers often cannot know how a photon was made, so they name the two by energy. To draw one scale, this explorer follows the common convention of calling everything shorter than 10 pm, above about 124 keV, a gamma ray.
Is ultraviolet light ionising radiation?
Only at its shortest wavelengths. UV-A and UV-B photons carry 3.1 to 4.4 eV, well short of the 12.6 eV that ionises a water molecule or the 13.6 eV that ionises a hydrogen atom, which needs a wavelength of 91.2 nm or less. They harm skin chemically instead: DNA absorbs UV-B, and two neighbouring thymine or cytosine bases on the same strand bond together, which is why sunburn and skin cancer come from ultraviolet that cannot ionise. X-rays and gamma rays, from about 124 eV upwards on this explorer’s scale, ionise whatever absorbs them.