QTc formulas compared: Bazett vs Fridericia vs Framingham vs Hodges
A QT of 320 ms at 120 bpm corrects to 452.5 ms by Bazett, 403.2 by Fridericia, 397.0 by Framingham and 425.0 by Hodges, a 55.5 ms spread. Only Bazett reaches 450 ms, where an adult man’s QTc counts as prolonged, and Bazett over-corrects at fast rates. At 60 bpm all four return the measured QT unchanged.
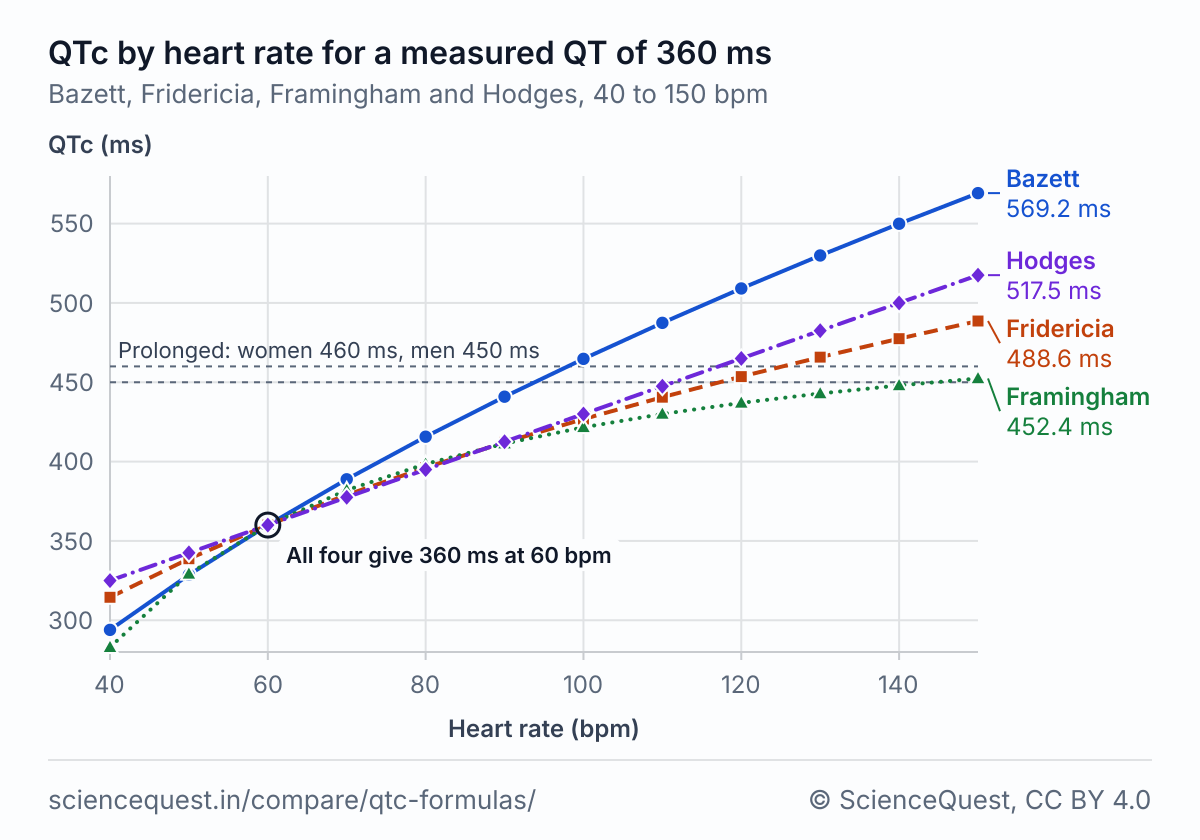
QTc by heart rate, measured QT 360 ms
| Heart rate (bpm) | RR s | Bazett ms | Fridericia ms | Framingham ms | Hodges ms | Spread ms |
|---|---|---|---|---|---|---|
| 40 | 1.500 | 293.9 | 314.5 | 283.0† | 325.0 | 42.0† |
| 50 | 1.200 | 328.6 | 338.8 | 329.2 | 342.5 | 13.9 |
| 60 | 1.000 | 360.0 | 360.0 | 360.0 | 360.0 | 0.0 |
| 70 | 0.857 | 388.8 | 379.0 | 382.0 | 377.5 | 11.3 |
| 80 | 0.750 | 415.7 | 396.2 | 398.5 | 395.0 | 20.7 |
| 90 | 0.667 | 440.9 | 412.1 | 411.3 | 412.5 | 29.6 |
| 100 | 0.600 | 464.8 | 426.8 | 421.6 | 430.0† | 43.2 |
| 110 | 0.545 | 487.4 | 440.6 | 430.0 | 447.5† | 57.4 |
| 120 | 0.500 | 509.1 | 453.6 | 437.0 | 465.0† | 72.1 |
| 130 | 0.462 | 529.9 | 465.8 | 442.9† | 482.5† | 87.0† |
| 140 | 0.429 | 549.9 | 477.5 | 448.0† | 500.0† | 101.9† |
| 150 | 0.400 | 569.2 | 488.6 | 452.4† | 517.5† | 116.8† |
RR = 60 ÷ heart rate. The spread is the highest QTc minus the lowest, worked before rounding, and is marked when either end is. † Outside the range the formula was fitted or tested over: Framingham’s 41 to 120 bpm (Sagie 1992) and Hodges’s under 90 bpm (Vandenberk 2016).
Six example tracings
| Tracing | Bazett ms | Fridericia ms | Framingham ms | Hodges ms | Spread ms | 450 ms or more |
|---|---|---|---|---|---|---|
| 50 bpm, 440 ms | 401.7 | 414.1 | 409.2 | 422.5 | 20.8 | None |
| 60 bpm, 400 ms | 400.0 | 400.0 | 400.0 | 400.0 | 0.0 | None |
| 80 bpm, 380 ms | 438.8 | 418.2 | 418.5 | 415.0 | 23.8 | None |
| 100 bpm, 340 ms | 438.9 | 403.1 | 401.6 | 410.0† | 37.3 | None |
| 120 bpm, 320 ms | 452.5 | 403.2 | 397.0 | 425.0† | 55.5 | Bazett |
| 140 bpm, 290 ms | 443.0 | 384.6 | 378.0† | 430.0† | 65.0† | None |
The last column tests 450 ms on unrounded values. For a woman the limit is 460 ms, which none of these six reaches by any formula. † Outside the range the formula was fitted or tested over: Framingham’s 41 to 120 bpm (Sagie 1992) and Hodges’s under 90 bpm (Vandenberk 2016).
The measured QT that reaches the limit
| Formula, sex | Heart rate (bpm) | ||||||||
|---|---|---|---|---|---|---|---|---|---|
| 50 | 60 | 70 | 80 | 90 | 100 | 110 | 120 | 130 | |
| Bazett, men | 493 | 450 | 417 | 390 | 368 | 349 | 333 | 319 | 306 |
| Fridericia, men | 479 | 450 | 428 | 409 | 394 | 380 | 368 | 358 | 348 |
| Framingham, men | 481 | 450 | 428 | 412 | 399 | 389 | 380 | 373 | 368† |
| Hodges, men | 468 | 450 | 433 | 415 | 398 | 380† | 363† | 345† | 328† |
| Bazett, women | 504 | 460 | 426 | 399 | 376 | 357 | 340 | 326 | 313 |
| Fridericia, women | 489 | 460 | 437 | 418 | 402 | 388 | 376 | 366 | 356 |
| Framingham, women | 491 | 460 | 438 | 422 | 409 | 399 | 390 | 383 | 378† |
| Hodges, women | 478 | 460 | 443 | 425 | 408 | 390† | 373† | 355† | 338† |
The shortest measured QT, in whole ms, that reaches the limit by that formula, found by bisection on the formula itself. † Outside the range the formula was fitted or tested over: Framingham’s 41 to 120 bpm (Sagie 1992) and Hodges’s under 90 bpm (Vandenberk 2016).
Why the formulas disagree
Each formula estimates the QT the same heart would show at 60 bpm, where RR is exactly 1 second, so all four return the measured QT at that rate. Away from 60 they part. Bazett divides by the square root of RR and Fridericia by the cube root, and for an RR under 1 second the square root is the smaller divisor. So above 60 bpm Bazett gives the higher QTc, 509.1 ms against Fridericia’s 453.6 for a QT of 360 ms at 120 bpm, and below 60 the order reverses.
Bazett fitted his curve to 39 young subjects in 1920. In 1992 Sagie and colleagues fitted a straight line to 5,018 Framingham adults aged 28 to 62, at rates from 41 to 120 bpm, and found that Bazett over-corrects at fast rates and under-corrects at slow ones. Hodges’s line adds 1.75 ms for each beat per minute above 60. Vandenberk’s group ran these four, and Rautaharju’s, on one ECG from each of 6,609 adults at University Hospitals Leuven, in sinus rhythm under 90 bpm with a QRS of 120 ms or less: Fridericia and Framingham removed the effect of rate best, and Bazett did worst.
At 120 bpm a man’s QTc reaches 450 ms by Bazett from a measured QT of 319 ms, and by Framingham only from 373 ms. In Vandenberk’s healthy subset, Bazett’s 99th-percentile QTc was 472 ms in men and 482 ms in women, above the 450 and 460 ms limits. ICH E14 (2005) asks drug applications for the raw QT, RR and rate beside both Bazett and Fridericia, because “the best correction approach is a subject of controversy”.
The formulas
Where each formula holds
| Formula | Fitted in | Holds for | Not for |
|---|---|---|---|
| Bazett (1920) | 39 young subjects | Rates near 60 bpm, and comparison with the many clinical reports that use it (ICH E14 3.1.1) | Fast rates, where it over-corrects (452.5 ms for 320 ms at 120 bpm), and slow rates, where it under-corrects. Rautaharju 2009 recommends linear regression corrections over Bazett, which can flag a normal QT as prolonged |
| Fridericia (1920) | Normal subjects and patients with heart disease | Drug trials, where ICH E14 asks for it beside Bazett; more accurate than Bazett at fast and slow rates | Removing rate entirely: it leaves a negative correlation with rate (r of −0.26 to −0.32) |
| Framingham (Sagie 1992) | 5,018 adults aged 28 to 62 without coronary disease, at 41 to 120 bpm | Adults in sinus rhythm at 41 to 120 bpm, the range it was fitted over | Rates outside 41 to 120 bpm, or children |
| Hodges (1983) | Not reported: the 1983 conference abstract is not online | Sinus rhythm under 90 bpm, where Vandenberk found it within 1 ms of Fridericia on average | Rates above 90 bpm, which Vandenberk’s comparison left out |
| All four | Sinus rhythm ECGs | One steady rate, with a measurable end of the T wave | Atrial fibrillation, where RR varies beat to beat, or a wide QRS (bundle branch block or a paced rhythm), which lengthens the QT |
Calculators and simulators
Sources
- Bazett HC. An analysis of the time-relations of electrocardiograms. Heart 1920;7:353 to 370. Reprinted in Annals of Noninvasive Electrocardiology 1997;2(2):177 to 194. doi:10.1111/j.1542-474X.1997.tb00325.x
- Fridericia LS. Die Systolendauer im Elektrokardiogramm bei normalen Menschen und bei Herzkranken. Acta Medica Scandinavica 1920;53:469 to 486. Translated by Gisela Beutner as The duration of systole in an electrocardiogram in normal humans and in patients with heart disease, Annals of Noninvasive Electrocardiology 2003;8(4):343 to 351. doi:10.1046/j.1542-474X.2003.08413.x
- Sagie A, Larson MG, Goldberg RJ, Bengtson JR, Levy D. An improved method for adjusting the QT interval for heart rate (the Framingham Heart Study). American Journal of Cardiology 1992;70(7):797 to 801. doi:10.1016/0002-9149(92)90562-D
- Hodges M, Salerno D, Erlien D. Bazett’s QT correction reviewed: evidence that a linear QT correction for heart rate is better. Journal of the American College of Cardiology 1983;1:694. A conference abstract with no full paper online; the link is Vandenberk 2016, which writes the formula out and cites it. Corrected in J Am Heart Assoc 2018;7:e004252 (the Hodges formula). https://doi.org/10.1161/JAHA.116.003264
- Vandenberk B, Vandael E, Robyns T, Vandenberghe J, Garweg C, Foulon V, Ector J, Willems R. Which QT correction formulae to use for QT monitoring? Journal of the American Heart Association 2016;5(6):e003264. Corrected in J Am Heart Assoc 2018;7:e004252 (the Hodges formula). doi:10.1161/JAHA.116.003264
- Correction to Vandenberk et al., Which QT correction formulae to use for QT monitoring? Journal of the American Heart Association 2018;7(16):e004252. It gives Hodges’s formula as QTc = QT + 1.75 × (60/RR − 60). doi:10.1161/JAHA.117.004252
- Rautaharju PM, Surawicz B, Gettes LS, et al. AHA/ACCF/HRS recommendations for the standardization and interpretation of the electrocardiogram, part IV: the ST segment, T and U waves, and the QT interval. Circulation 2009;119(10):e241 to e250. doi:10.1161/CIRCULATIONAHA.108.191096
- ICH E14. The clinical evaluation of QT/QTc interval prolongation and proarrhythmic potential for non-antiarrhythmic drugs. Step 4 version, 12 May 2005, section 3.1 (3.1.1, population-derived correction formulae). https://database.ich.org/sites/default/files/E14_Guideline.pdf
The values are facts and free to use; this table’s selection and presentation are © 2026 ScienceQuest.