Body surface area: Mosteller vs Du Bois vs Haycock vs Gehan and George
At 170 cm and 70 kg the four formulas agree within 0.022 m², 1.2 percent of Mosteller. At 160 cm and 150 kg Du Bois gives 2.394 m² and Haycock 2.685 m², 0.291 m² apart, 11.3 percent of Mosteller’s 2.582 m². At 170 cm Du Bois gives the most up to 60 kg and the least from 70 kg.
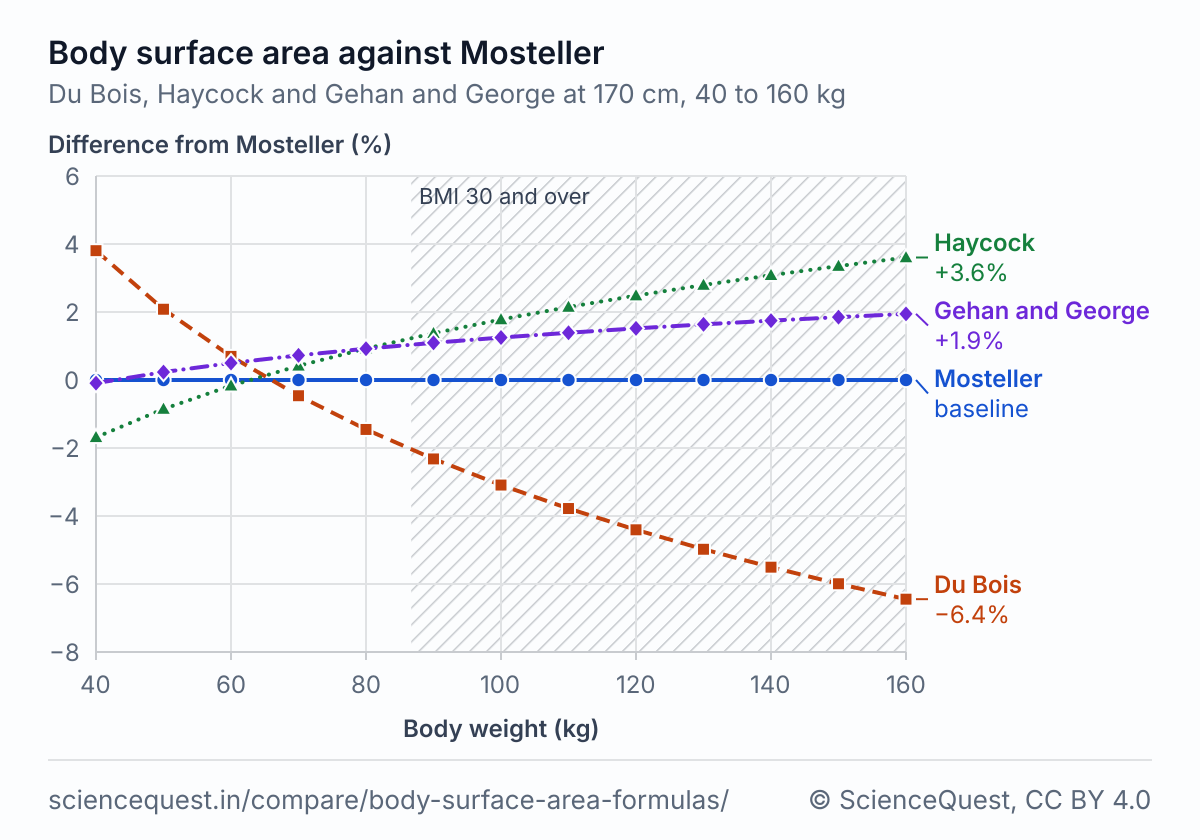
Body surface area at 170 cm, 40 to 160 kg
| Weight (kg) | Body surface area | Difference from Mosteller | |||||
|---|---|---|---|---|---|---|---|
| Mosteller m² | Du Bois m² | Haycock m² | Gehan and George m² | Du Bois % | Haycock % | Gehan and George % | |
| 40 | 1.374 | 1.427 | 1.351 | 1.373 | +3.8 | −1.7 | −0.1 |
| 50 | 1.537 | 1.569 | 1.523 | 1.540 | +2.1 | −0.9 | +0.2 |
| 60 | 1.683 | 1.695 | 1.680 | 1.692 | +0.7 | −0.2 | +0.5 |
| 70 | 1.818 | 1.810 | 1.826 | 1.831 | −0.5 | +0.4 | +0.7 |
| 80 | 1.944 | 1.915 | 1.962 | 1.962 | −1.5 | +0.9 | +0.9 |
| 90 | 2.062 | 2.014 | 2.090 | 2.084 | −2.3 | +1.4 | +1.1 |
| 100 | 2.173 | 2.106 | 2.212 | 2.200 | −3.1 | +1.8 | +1.2 |
| 110 | 2.279 | 2.193 | 2.328 | 2.311 | −3.8 | +2.1 | +1.4 |
| 120 | 2.380 | 2.276 | 2.440 | 2.417 | −4.4 | +2.5 | +1.5 |
| 130 | 2.478 | 2.354 | 2.547 | 2.518 | −5.0 | +2.8 | +1.6 |
| 140 | 2.571 | 2.430 | 2.650 | 2.616 | −5.5 | +3.1 | +1.7 |
| 150 | 2.661 | 2.502 | 2.751 | 2.711 | −6.0 | +3.4 | +1.8 |
| 160 | 2.749 | 2.572 | 2.848 | 2.802 | −6.4 | +3.6 | +1.9 |
A difference is that formula’s area minus Mosteller’s, as a percentage of Mosteller’s. The chart draws the three difference columns.
Body surface area at 8 body sizes
| Height and weight (BMI) | Body surface area | Spread of the four | ||||
|---|---|---|---|---|---|---|
| Mosteller m² | Du Bois m² | Haycock m² | Gehan and George m² | Spread m² | Spread % of Mosteller | |
| 150 cm, 45 kg (20.0) | 1.369 | 1.370 | 1.370 | 1.384 | 0.014 | 1.1 |
| 160 cm, 55 kg (21.5) | 1.563 | 1.563 | 1.566 | 1.577 | 0.013 | 0.9 |
| 165 cm, 60 kg (22.0) | 1.658 | 1.659 | 1.661 | 1.670 | 0.012 | 0.7 |
| 170 cm, 70 kg (24.2) | 1.818 | 1.810 | 1.826 | 1.831 | 0.022 | 1.2 |
| 180 cm, 85 kg (26.2) | 2.062 | 2.049 | 2.073 | 2.073 | 0.025 | 1.2 |
| 190 cm, 100 kg (27.7) | 2.297 | 2.283 | 2.311 | 2.306 | 0.029 | 1.2 |
| 160 cm, 150 kg (58.6) | 2.582 | 2.394 | 2.685 | 2.642 | 0.291 | 11.3 |
| 200 cm, 90 kg (22.5) | 2.236 | 2.266 | 2.229 | 2.232 | 0.037 | 1.6 |
The spread is the highest of the four minus the lowest, worked out from the unrounded areas, so it can differ by 0.001 from the printed cells. BMI in kg/m², as the BMI calculator prints it.
Mosteller body surface area by height and weight
| Height (cm) | Weight (kg) | ||||||||||
|---|---|---|---|---|---|---|---|---|---|---|---|
| 40 | 50 | 60 | 70 | 80 | 90 | 100 | 110 | 120 | 130 | 140 | |
| 140 | 1.25 | 1.39 | 1.53 | 1.65 | 1.76 | 1.87 | 1.97 | 2.07 | 2.16 | 2.25 | 2.33 |
| 145 | 1.27 | 1.42 | 1.55 | 1.68 | 1.80 | 1.90 | 2.01 | 2.10 | 2.20 | 2.29 | 2.37 |
| 150 | 1.29 | 1.44 | 1.58 | 1.71 | 1.83 | 1.94 | 2.04 | 2.14 | 2.24 | 2.33 | 2.42 |
| 155 | 1.31 | 1.47 | 1.61 | 1.74 | 1.86 | 1.97 | 2.07 | 2.18 | 2.27 | 2.37 | 2.46 |
| 160 | 1.33 | 1.49 | 1.63 | 1.76 | 1.89 | 2.00 | 2.11 | 2.21 | 2.31 | 2.40 | 2.49 |
| 165 | 1.35 | 1.51 | 1.66 | 1.79 | 1.91 | 2.03 | 2.14 | 2.25 | 2.35 | 2.44 | 2.53 |
| 170 | 1.37 | 1.54 | 1.68 | 1.82 | 1.94 | 2.06 | 2.17 | 2.28 | 2.38 | 2.48 | 2.57 |
| 175 | 1.39 | 1.56 | 1.71 | 1.84 | 1.97 | 2.09 | 2.20 | 2.31 | 2.42 | 2.51 | 2.61 |
| 180 | 1.41 | 1.58 | 1.73 | 1.87 | 2.00 | 2.12 | 2.24 | 2.35 | 2.45 | 2.55 | 2.65 |
| 185 | 1.43 | 1.60 | 1.76 | 1.90 | 2.03 | 2.15 | 2.27 | 2.38 | 2.48 | 2.58 | 2.68 |
| 190 | 1.45 | 1.62 | 1.78 | 1.92 | 2.05 | 2.18 | 2.30 | 2.41 | 2.52 | 2.62 | 2.72 |
| 195 | 1.47 | 1.65 | 1.80 | 1.95 | 2.08 | 2.21 | 2.33 | 2.44 | 2.55 | 2.65 | 2.75 |
| 200 | 1.49 | 1.67 | 1.83 | 1.97 | 2.11 | 2.24 | 2.36 | 2.47 | 2.58 | 2.69 | 2.79 |
Areas in m², to the nearest 0.01. For a height or weight between the steps, the body surface area calculator gives all four formulas.
Why the formulas disagree
Each formula splits the area between height and weight in its own proportion. Mosteller raises both to the power 0.5; the powers on height and weight are Du Bois 0.725 and 0.425, Haycock 0.3964 and 0.5378, Gehan and George 0.42246 and 0.51456. Quadruple the weight at 170 cm, from 40 to 160 kg, and Mosteller’s area grows 2.00 times, Du Bois’s 1.80 times and Haycock’s 2.11 times. Du Bois leans hardest on height, so it reads high for light and tall people and low for heavy ones.
Du Bois and Du Bois chose both powers and the constant to fit nine people, and put the error at 1.5 percent on average and up to 5 percent in people “of unusual shape”. Haycock’s group worked out the area of 81 people, from premature infants to adults, from 34 body measurements each, and found Du Bois reading low below 0.7 m², by 7.96 percent in newborns. Gehan and George fitted theirs to 401 people from Boyd’s 1935 data; Mosteller cut it to one square root for pocket calculators.
At a BMI of 18.5 to under 30 the spread of the four stays within 1.6 percent of Mosteller’s area in the body size table, but in 1 cm and 1 kg steps from 150 to 200 cm at those BMIs it reaches 4.6 percent, at 150 cm and 67 kg. At 160 cm and 150 kg it is 11.3 percent. With obesity the dosing protocol also sets which weight goes in, actual or adjusted, and whether the dose is capped at a BSA of 2 m² (Mohamed 2026).
The formulas
h is height in cm and w is weight in kg; each gives BSA in m². Du Bois wrote his constant as 71.84 with the area in cm².
Where each formula holds
| Formula | Fitted in | Holds for | Not for |
|---|---|---|---|
| Mosteller (1987) | No measurements of its own: a one-line simplification of Gehan and George | The range of Gehan and George’s data, infants to adults, since it simplifies their formula (Mohamed 2026) | Obesity: none of the common formulas had been validated in obese patients when Livingston and Lee (2001) measured 45 people weighing 51.3 to 248.6 kg and fitted a formula on weight alone |
| Du Bois (1916) | Nine people measured in the authors’ laboratory | Adults of average build, with an average error the authors put at 1.5 percent | Obesity, where it read up to 20 percent low (Livingston and Lee 2001); infants, where it reads up to 7.96 percent low (Haycock 1978); and people of unusual shape, where the authors allowed up to 5 percent |
| Haycock (1978) | 81 people from premature infants to adults, each area worked out from 34 measurements | Areas from under 0.2 m² to over 2.0 m², the range of its sample (r = 0.998) | Obesity: none of the common formulas had been validated in obese patients when Livingston and Lee (2001) measured 45 people weighing 51.3 to 248.6 kg and fitted a formula on weight alone; at 160 cm and 150 kg it gives 2.685 m², the most of the four |
| Gehan and George (1970) | 401 people from Boyd’s 1935 data: 229 infants, 42 children and 130 adults | Infants to adults, the range of Boyd’s data | Obesity: none of the common formulas had been validated in obese patients when Livingston and Lee (2001) measured 45 people weighing 51.3 to 248.6 kg and fitted a formula on weight alone |
Calculators and simulators
Sources
- Mosteller RD. Simplified calculation of body-surface area. N Engl J Med 1987;317(17):1098. doi:10.1056/NEJM198710223171717
- Du Bois D, Du Bois EF. Clinical calorimetry, tenth paper: a formula to estimate the approximate surface area if height and weight be known. Arch Intern Med 1916;17(6):863-871. A free scan of the issue is at archive.org/details/sim_jama-internal-medicine_1916-06-15_17_6. doi:10.1001/archinte.1916.00080130010002
- Haycock GB, Schwartz GJ, Wisotsky DH. Geometric method for measuring body surface area: a height-weight formula validated in infants, children, and adults. J Pediatr 1978;93(1):62-66. doi:10.1016/S0022-3476(78)80601-5
- Gehan EA, George SL. Estimation of human body surface area from height and weight. Cancer Chemother Rep 1970;54(4):225-235. The journal is not online; its sample is as Mohamed and colleagues (2026) describe it. https://pubmed.ncbi.nlm.nih.gov/5527019/
- Livingston EH, Lee S. Body surface area prediction in normal-weight and obese patients. Am J Physiol Endocrinol Metab 2001;281(3):E586-E591. doi:10.1152/ajpendo.2001.281.3.E586
- Mohamed AAA, van Londen M, Stevens J, Heerspink HJL, Gansevoort RT. Indexing for body surface area when assessing kidney function. Nephrol Dial Transplant 2026;41(9):1595-1605. doi:10.1093/ndt/gfag063
- Centers for Disease Control and Prevention. Adult BMI Categories. For adults 20 and older. https://www.cdc.gov/bmi/adult-calculator/bmi-categories.html
The values are facts and free to use; this table’s selection and presentation are © 2026 ScienceQuest.