PCR Simulator
A virtual PCR simulator: watch each cycle denature, anneal and extend, find where your primers bind on both strands, and run the product on a gel.
Simulator
Drag the anneal step, or press up and down, to set the annealing temperature. Left and right step a cycle, and a tap on the ledger picks one. Space plays and pauses.
The run is at its initial denaturation. A temperature trace shows denaturing at 95 °C, annealing at 50.0 °C and extending at 72 °C. The molecule shows the forward and reverse primers at their sites, 98.7 and 99.5 percent primed, around a 110 bp product. The ledger shows cycle 1: about 0 of 2.0 duplexes from one template are exact length. The gel shows the product beside a 100 bp ladder, 100 to 1,000 bp in 2 percent agarose.
- Product length From the 5′ end of the forward primer to the 5′ end of the reverse primer, template bases 514 to 623.
- 110 bp
- Copies after 30 cycles N = Nmax u ÷ (1 + u), u = N₀(1 + E)ⁿ ÷ Nmax, the qPCR simulator’s logistic curve: 31,600 starting copies grow by 1.991 a cycle for 30 cycles towards a plateau of 10¹² copies. Without the plateau it would be 2.96 × 10¹³.
- 9.67 × 10¹¹
- Product mass copies × 110 bp × 650 g/mol per bp ÷ 6.022 × 10²³ per mol, in the whole 50 µL reaction. A 5 µL load carries a tenth of it.
- 115 ng
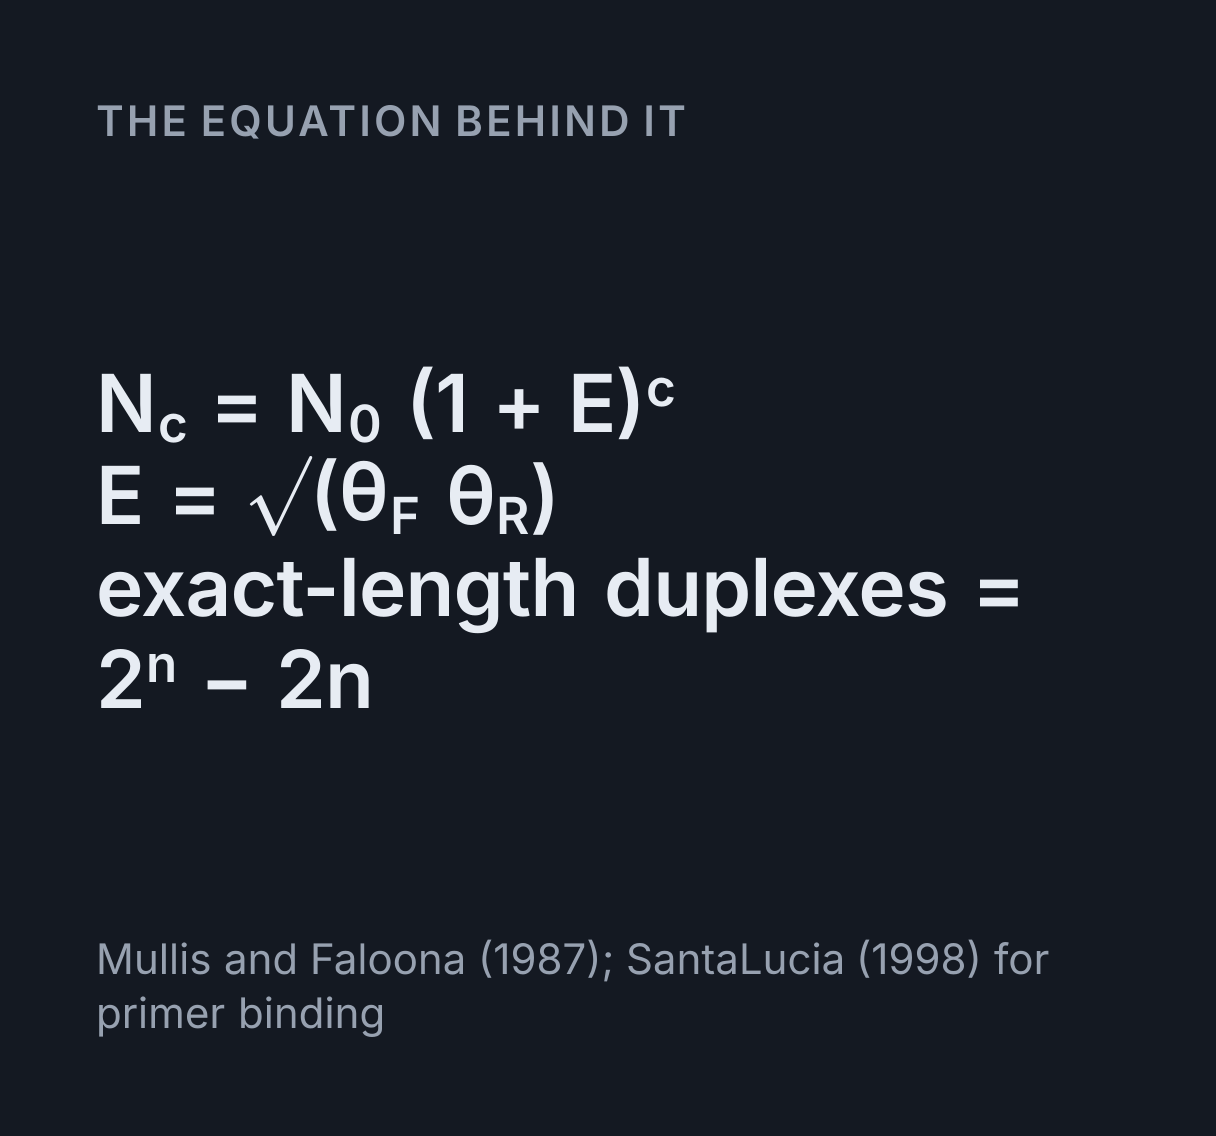
- Efficiency per cycle E = √(eL × eR) = √(0.987 × 0.995) = 0.9909: the larger eigenvalue of a′ = a + eL b, b′ = b + eR a, less one. Each e is the share of sites primed, the extension being long enough.
- 99.1 %
- Exact-length share Of the 931,944,461 duplexes one template would be expected to have become after 30 cycles, leaving the plateau aside, 931,944,402 are exactly 110 bp. Every strand copied, it would be 2ⁿ − 2n of 2ⁿ.
- 99.99999 %
- Band visible after The first cycle after which a 5 µL load from the 50 µL reaction carries about 1 ng of the 110 bp product, where the gel here starts to show its band. By then the reaction holds about 1.07 × 10¹¹ copies. The brightness is drawn on a log scale up to 100 ng.
- 22 cycles
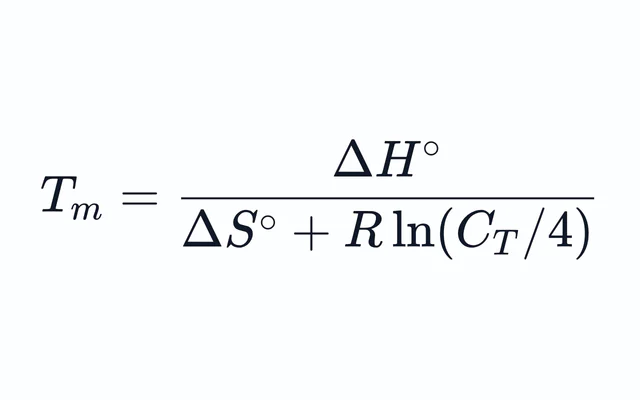
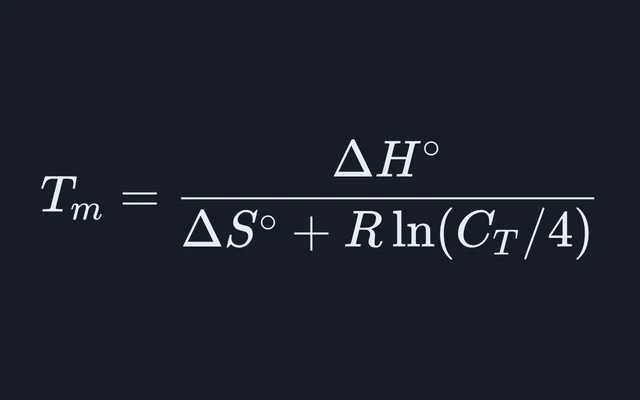
- Forward primer Tm Nearest neighbour, exactly as the Primer Tm Calculator works it: Tm = 1000ΔH° ÷ (ΔS° + R ln C) = 1000 × (−154.9) ÷ (−434.5 + 1.987 × ln(1.25 × 10⁻⁸)) = 329.1 K, or 55.93 °C, with C = CT/4 in mol/L and ΔS° corrected for 164 mM of sodium equivalent.
- 55.93 °C
- Reverse primer Tm Nearest neighbour, exactly as the Primer Tm Calculator works it: Tm = 1000ΔH° ÷ (ΔS° + R ln C) = 1000 × (−157.3) ÷ (−440.2 + 1.987 × ln(1.25 × 10⁻⁸)) = 330.2 K, or 57.03 °C, with C = CT/4 in mol/L and ΔS° corrected for 164 mM of sodium equivalent.
- 57.03 °C
- Primed at Ta The share of its sites each primer occupies at 50 °C, left primer then right: θ = KC ÷ (1 + KC), K = exp(−(ΔH° − TΔS°) ÷ RT), from the same ΔH°, ΔS° and C = CT/4 as the Tm, so θ is exactly one half at the Tm.
- 98.7, 99.5 %
- Highest Ta for 95% priming T = 1000ΔH° ÷ (ΔS° + R ln C − R ln(0.95 ÷ 0.05)) for each primer, the lower of the two: below it both hold at least 95 percent of their sites. The Primer3 manual suggests annealing 6 to 10 °C below the lower Tm, where it expects 95 to 98 percent of a primer bound, a share it works out for primer and template at equal concentration, which climbs more slowly as the anneal cools than this share of sites.
- 51.9 °C
- Extension needed 110 bp at a minute per kilobase: 110 × 60 ÷ 1000 = 6.6 s. The step here is 30 s, so every primed strand is finished.
- 6.6 s
- Product Tm (estimate) 81.5 + 16.6 log₁₀[Na⁺] + 0.41(%GC) − 600 ÷ N, the long-sequence formula in the Primer3 manual: 57 of 110 bases G or C, 51.8 percent, with [Na⁺] = 0.164 M counting the magnesium as sodium. A long duplex melts in stages, so treat it as a guide.
- 84.3 °C
- Copies of the product in this reaction
- Every strand copied, N₀ × 2ⁿ
- Plateau, 10¹² copies
The product
110 bp, template bases 514 to 623, 57 bases G or C (51.8%).
Product bases 56 to 58, GAG, are codon 6 of β-globin in the traditional numbering, p.Glu7 in HGVS numbering. The sickle-cell variant changes it to GTG. This is a demonstration on the reference sequence, not a genetic test: it says nothing about anyone’s genotype.
Where the primers pair
5′-ACACAACTGTGTTCACTAGC-3′ PC03 3′-TGTGTTGACACAAGTGATCG-5′ bottom strand
5′-GGTGAACGTGGATGAAGTTG-3′ top strand 3′-CCACTTGCACCTACTTCAAC-5′ PC04
The template
forward site reverse site product codon 6
Template: human β-globin, HBB (NCBI Gene 3043), from NG_000007.3, bases 70,045 to 71,039: the 500 bases before the transcription start, exon 1, intron 1 and exon 2. From the National Center for Biotechnology Information, part of the US National Library of Medicine; NCBI places no restrictions on the use or distribution of the data in its molecular databases.
The gel’s band brightness is drawing only: the mass in a 5 µL load from the 50 µL reaction, on a log scale from invisible at 1 ng to full at 100 ng. The band positions are the Gel Electrophoresis Simulator’s, at 100 V for an hour.
Citing this tool
Last updated . Add the date you accessed it as well, which a citation of a page that can change asks for. If a specific result matters, cite the permalink from the tool’s share row instead of this page: it reproduces the exact parameters.
On the syllabus: AP Biology, Unit 6: Gene Expression and Regulation; MCAT, 1B: Transmission of genetic information from the gene to the protein.
The equation
Mullis and Faloona (1987); SantaLucia (1998) for primer binding
What are the three steps of a PCR amplification cycle?
The polymerase chain reaction (PCR) exponentially amplifies target DNA through repeated thermal cycles of three steps: denaturation at 94 °C to 98 °C (melting double strands), primer annealing at 50 °C to 65 °C (binding sequence-specific oligonucleotides), and primer extension at 72 °C by thermostable Taq DNA polymerase. At perfect efficiency every cycle doubles the target, so after n cycles N = N0 · 2n.
What happens in one PCR cycle
The polymerase chain reaction copies one stretch of DNA, the stretch between two primers, over and over. Each cycle is three temperatures doing three jobs:
- Denature at 95 °C. The two strands of every duplex come apart, so each can be read on its own.
- Anneal, here at 50 °C. Each primer, a short single strand, pairs with its site: the forward primer with the bottom strand and the reverse primer with the top. The temperature is set from the primers’ Tm, cool enough for them to stay bound.
- Extend at 72 °C. Taq polymerase adds bases to each primer’s 3′ end, copying the strand it sits on, so every strand primed becomes two.
The stage draws all three at once: the thermal cycler’s temperature trace across the top, the template and its primers in the middle, a ledger of what one template has become underneath, and a gel of the product at the side. Colour carries the meaning everywhere: the forward primer, its site and every strand it starts in blue, the reverse primer and its strands in amber, the polymerase in violet, and exact-length products in green, on the molecule, in the ledger and as the product’s band on the gel, beside a grey ladder.
Using the simulator
The run opens on human β-globin and plays itself: cycle 1 slowly, cycles 2 to 4 while the ledger builds the textbook figure, then the rest quickly while the chart climbs and the band appears on the gel. Drag the anneal step on the temperature trace up or down to change the annealing temperature, and every share primed, the efficiency, the chart and the band follow at once. A tap on a cycle in the ledger shows that cycle, and the arrow keys on the selected scene step a cycle or move the temperature.
Type or paste your own template and primers, up to 5,000 bases, and the simulator finds where each primer binds on both strands, the product they make and its sequence. Under the stage, the panel shows each primer paired base by base with its strand, the template with both sites marked, and the product, ready to copy as FASTA or to hand to the Gel Electrophoresis Simulator to cut with restriction enzymes. When there is no product, the notes beside the stage say why.
Worked example: β-globin, the first PCR
The opening template is 995 bases of the human β-globin gene, HBB, and the stretch before it, from NCBI record NG_000007.3, with the primer pair PC03 and PC04 from Saiki and colleagues’ PCR papers of 1985 and 1988. Their 1985 paper reported amplifying β-globin sequences 220,000 times from genomic DNA. The same pair is still a common check that a DNA extraction worked.
- The sites. PC03, ACACAACTGTGTTCACTAGC, matches the top strand at bases 514 to 533, so it pairs with the bottom strand and faces right. PC04, CAACTTCATCCACGTTCACC, is the reverse complement of bases 604 to 623, so it pairs with the top strand and faces left.
- The product runs from base 514 to base 623: 110 bp, with 57 of its bases G or C. Its bases 56 to 58, GAG, are codon 6 of β-globin, the codon the sickle-cell variant changes to GTG. This is the reference sequence and a demonstration of the method, not a genetic test.
- The Tms. By the Primer Tm Calculator’s nearest-neighbour method in Primer3’s default buffer, PC03 melts at 55.9 °C and PC04 at 57.0 °C.
- Priming at 50 °C. PC03 occupies 98.7 percent of its sites and PC04 99.5 percent, so the
efficiency per cycle is
E = √(0.9872 × 0.9946) = 0.991. - The run. 31,600 starting copies, about 100 ng of human DNA, grow by 1.991 a cycle. They pass half of the 10¹² copy plateau near cycle 25 and end cycle 30 at about 9.7 × 10¹¹ copies.
- The mass.
9.67 × 10¹¹ × 110 bp × 650 g/mol ÷ 6.022 × 10²³ = 115 ngin the 50 µL reaction, so a 5 µL load puts 11.5 ng in the well.
Why the exact-length product appears in cycle 3
In cycle 1 each primer copies the original template as far as the polymerase gets, so the new strands have one end set by a primer and the other wherever the copying stopped: long products. At the default 30 s extension the forward strand runs 482 bases to the end of the template, and the reverse strand 500 bases, to template base 124. In cycle 2 a primer bound to a long product copies it only as far as its 5′ end, which is the other primer’s site, so the first strand of exactly the product’s length appears, still paired with a long one. In cycle 3 those strands are copied in turn, and the first two duplexes with both ends defined appear.
From one template with every strand copied, the exact-length duplexes after n cycles number
2ⁿ − 2n of 2ⁿ: 0, 0, 2, 8, 22 and 52 after cycles 1 to 6. The rest are the two duplexes that
hold an original strand and the 2n − 2 that hold a long product, a number that grows by two a cycle while the
product doubles, so by cycle 30 the exact-length share is 99.99999 percent. At the opening 99.1 percent
efficiency the ledger shows expected values instead, 1.9 of 7.9 duplexes in cycle 3.
Choosing the annealing temperature
Work from the lower primer Tm. At the Tm a primer holds exactly half its sites, and the share climbs as the temperature falls: here both primers hold at least 95 percent of their sites up to 51.9 °C. At 55 °C they hold 66 and 81 percent, and the efficiency falls to 0.734. At 58 °C they hold only 19 and 33 percent, and the 30-cycle gain, leaving the plateau aside, collapses from 936 millionfold to 761-fold, too little product to see on the gel. Drag the anneal step past the Tms and watch the primers land and fall away.
The Primer Tm Calculator works out each primer’s Tm in your buffer, and the Primer3 manual suggests annealing 6 to 10 °C below it, where it expects 95 to 98 percent of a primer to be bound. Primer3 works that share out for primer and template at equal concentration. The shares here are of a primer’s sites, with primer to spare as in a real reaction, so they climb towards 100 percent faster as the anneal cools. Colder costs nothing in this model, which sees only perfect sites, but on the bench a cold anneal lets primers start at partial matches and make extra bands, which is why the simulator warns when the anneal is more than 10 °C below the lower Tm.
Extension time and product length
Protocols give Taq about a minute per kilobase, and the simulator uses that rule as the polymerase’s speed: the 110 bp β-globin product needs 6.6 s, and a 3 kb product 3 minutes. In the simulator a shorter step finishes no new strand, so none reaches the far primer’s site, nothing new can be copied back and the product is not amplified at all. Set the extension to 5 s and the polymerase stops after 83 bases, short of the 110 it needs. On the bench the cut-off is softer: Taq also copies, more slowly, during the anneal and the climb to 72 °C, and products of about 100 bp have been amplified with Taq in a combined anneal and extension of 1 s.
Why PCR stops doubling
Every strand copied every cycle would multiply the product 2³⁰ times, about 1.07 × 10⁹, in 30 cycles. Real reactions run short of primers, nucleotides and active enzyme, and product strands start pairing with each other instead of with primers, so growth slows to a plateau. The simulator uses the logistic curve of the qPCR and ΔΔCt Simulator, with its plateau of 10¹² copies. Without the plateau the default run would end with 3.0 × 10¹³ copies, 3.5 µg of product, instead of 115 ng. Because the plateau hides how much template there was, qPCR reads each reaction in its exponential phase.
Reading the product on a gel
The gel strip runs the product beside a ladder, with the Gel Electrophoresis Simulator’s own model: 2 percent agarose for products under 500 bp, at 100 V for an hour. There the 110 bp band ends 5.74 cm from its well, just above the ladder’s 100 bp band at 5.82 cm. Its brightness follows the mass in the well, drawn on a log scale from invisible at 1 ng to full at 100 ng, so the band first shows near cycle 22. To check the size of a product or what an enzyme does to it, hand the sequence to that simulator from the panel under the stage.
The Reverse Complement Calculator turns a reverse primer written as the top strand into the sequence to order, and the DNA to Protein Translator reads the product’s codons: the β-globin product holds the first 24 of them. To turn an absorbance reading of a purified product into a concentration, use the Nucleic Acid Quantification Calculator, and for the double helix itself, the strands this simulator pulls apart, the DNA Double Helix Explorer.
What this model leaves out
- Mispriming and primer-dimers. Only perfect sites prime, so a cold anneal costs nothing here, and primers never pair with each other. A real primer often still works with a mismatch several bases in from its 3′ end, which here leaves it with no site.
- Secondary structure, inhibitors and errors. No hairpins, nothing in the sample slowing the enzyme, and every copy is perfect.
- Competition between products. Several products each grow as if they were alone.
- Tailed primers in the first cycles. A primer with a 5′ tail binds the original template, and the long products copied from it, with only its matching part, but is treated as binding with its whole length, as it does from the third cycle on to the exact-length strands, which carry the tail’s complement.
- The plateau. 10¹² copies is a round model figure, not a measured yield.
Common mistakes
- Typing the reverse primer as the top strand. Both primers then face the same way and nothing is made. Write it 5′ to 3′ on the bottom strand, the reverse complement of the top strand at its site.
- Mixing up the 5′ and 3′ ends. The polymerase extends only from a primer’s 3′ end, so that end must match: here a site needs the last 15 bases to pair exactly, and one mismatch there leaves the primer with no site, while a 5′ tail is simply copied into the product.
- Primers with very different Tms. A temperature that suits the cooler primer runs the warmer one far below its Tm, which on the bench invites mispriming. Keep the two within about 5 °C.
- Too short an extension. Here, below a minute per kilobase no strand is finished, and the product is never made at all. On the bench the cut-off is softer, since Taq also copies during the anneal, but a long product needs a longer step.
Model and assumptions
- Method
- Exact expression, no time stepping
- Repeatability
- Deterministic. The same link gives the same numbers on any machine.
What it assumes
- A primer binds wherever its last 15 bases, at the 3′ end, pair exactly with a strand, the default of UCSC’s In-Silico PCR, and any 5′ bases that do not pair are copied into the product as a tail.
- Each template strand is primed with the equilibrium share of its sites bound at the annealing temperature, θ = KC/(1 + KC), from the same ΔH°, ΔS° and effective concentration CT/4 as the primer’s nearest-neighbour Tm, so θ is one half at the Tm.
- Every primed strand is copied in full when the extension time covers the product at a minute per kilobase, and none is finished when it does not, so the efficiency per cycle is √(eL eR) or nothing.
- Growth slows to a plateau of 10¹² copies along the logistic curve the qPCR simulator uses, which is a round model figure rather than a measured yield.
- There is no mispriming, no primer-dimer, no secondary structure, no inhibitor and no polymerase error, so a low annealing temperature costs nothing here, and several products each grow as if alone.
- The product’s mass counts each copy at 650 g/mol per base pair, and the gel places its bands with the Gel Electrophoresis Simulator’s model at 100 V for an hour, their brightness drawn from the mass loaded.
Where it stops holding. Genomic templates at low annealing temperatures, where partial matches elsewhere in the genome make products this model cannot see; choosing primers whose Tms suit the anneal is the first defence. The Primer Tm Calculator is the right tool there.
Numerical accuracy
No method error to report: the result is a closed-form expression evaluated directly, with no time stepping to accumulate error. What remains is double-precision rounding, of order one part in 10^16 per operation.
Constants used: Avogadro constant (NA) and Molar gas constant (R).
Common questions
What happens in each step of a PCR cycle?
Denaturing at 95 °C separates the two strands of every duplex. Annealing, at 50 °C in this simulator’s opening run, a temperature set from the primers’ Tm, lets each primer pair with its site: the forward primer with the bottom strand and the reverse primer with the top. Extending at 72 °C lets Taq polymerase copy from each primer’s 3′ end. The simulator draws all three on the thermal trace and on the molecule, and every strand made becomes a template in the next cycle.
How many copies does PCR make after 30 cycles?
At most 2³⁰, about 1.07 × 10⁹ for each starting molecule, if every strand were copied every cycle. In this simulator’s opening reaction, 31,600 copies of β-globin, roughly 100 ng of human DNA, grow by 1.991 a cycle, pass half of the model’s 10¹² copy plateau near cycle 25 and hold about 9.7 × 10¹¹ copies by cycle 30, some 115 ng of the 110 bp product.
Why does the exact-length product only appear in cycle 3?
Because the first copies have only one end set by a primer. In cycle 1 each primer copies the original template as far as the polymerase gets, making long products. In cycle 2 a primer on a long product can copy it only as far as its 5′ end, the other primer’s site, which makes the first strands of exactly the product’s length, each still paired with a long one. Cycle 3 copies those, giving the first two duplexes with both ends defined. From one template the exact-length duplexes number 2ⁿ − 2n: 0, 0, 2, 8, 22 and 52 after cycles 1 to 6.
How do I choose the annealing temperature for PCR?
Work from the lower primer Tm. The β-globin primers PC03 and PC04 melt at 55.9 and 57.0 °C, and in this simulator both still hold at least 95 percent of their sites up to 51.9 °C. At 55 °C they hold 66 and 81 percent of their sites, and at 58 °C only 19 and 33 percent, which, leaving the plateau aside, cuts the 30-cycle gain from almost a billionfold to under a thousandfold. The Primer3 manual suggests annealing 6 to 10 °C below the Tm; much colder, and a real reaction starts to prime at partial matches too.
Why does my in silico PCR find no product?
Often the reverse primer was typed as it reads on the top strand instead of 5′ to 3′ on the bottom strand, so both primers face the same way. The primers may also face away from each other, or a primer’s 3′ end may not match: here a site needs the primer’s last 15 bases to pair exactly. The simulator names which it is, draws the primers on the template pointing the way they face, and for a primer with no site shows its nearest match and where the mismatches are.
How long should the PCR extension step be?
About a minute per kilobase for Taq, the usual protocol rule, so the 110 bp β-globin product needs 6.6 s and a 3 kb product 3 minutes. The simulator holds to the rule: with a shorter step no new strand reaches the far primer’s site, so nothing new can be copied back and the product is not amplified at all, and at 5 s the simulator’s polymerase stops after 83 of the 110 bases. On the bench the cut-off is softer, since Taq also copies during the anneal and the climb to 72 °C, and products of about 100 bp have been amplified with Taq in a combined anneal and extension of 1 s.
What is the difference between PCR and qPCR?
PCR is read once, at the end, usually on a gel that shows the product’s size and roughly how much there is, which is where this simulator ends. qPCR, real-time PCR, measures fluorescence every cycle and reads the cycle at which it crosses a threshold, which shows how much template the reaction started with. The qPCR and ΔΔCt Simulator models those threshold cycles and the fold changes worked out from them.