Stopping Distance Simulator
Watch a car brake to a stop: thinking distance plus braking distance v²/2μg, set by speed, reaction time, road surface and slope, with impact speed.
Simulator
Drag the crossing, the speedometer’s needle or the far end of the road. The arrow keys move the crossing and tilt the road, and R replays. Space plays and pauses.
Car on a level road, with a zebra crossing 25 m ahead. This vehicle at 50 km/h covers 9.31 m while the driver reacts and 14.75 m braking, stopping 0.95 m short of the crossing. The comparison at 60 km/h covers 11.17 m while the driver reacts and 21.23 m braking, reaching the crossing at 35.4 km/h.
- Stopping distance The thinking distance and the braking distance together. Car lengths at the Highway Code’s 4 m a car.
- 24.05 m, 6 car lengths
- Thinking distance Speed × reaction time = 13.89 m/s × 0.67 s, covered at full speed before the brakes come on. Each extra tenth of a second adds 1.39 m.
- 9.31 m
- Braking distance v²/2a = (13.89 m/s)² ÷ (2 × 6.54 m/s²). Twice the speed would need four times as far.
- 14.75 m
- Time to stop Reaction time + v/a = 0.67 s + 2.12 s of braking.
- 2.79 s
- Deceleration g(μ cos θ + sin θ), with μ = 0.667, the grip that rebuilds the Highway Code’s table.
- 6.54 m/s², 0.667 g
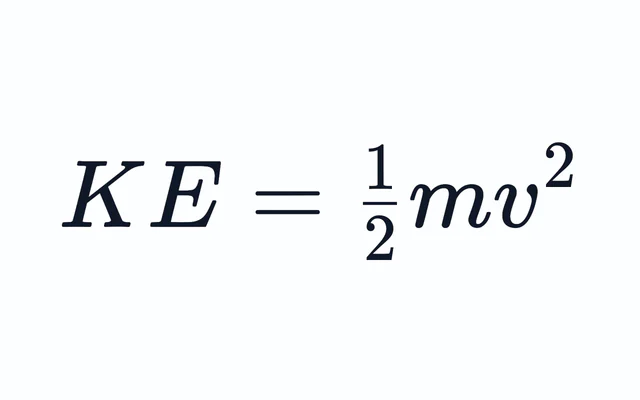
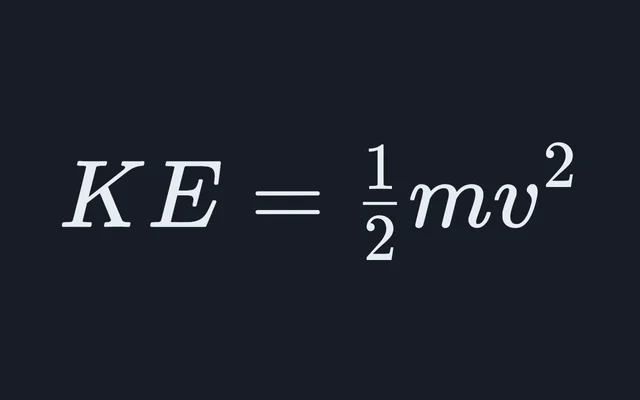
- Heat from braking ½mv² = 144.7 kJ for a nominal 1,500 kg car. The heat goes into the brakes, or into the tyres and the road when the wheels lock. The mass cancels from the distance but not from the energy.
- 144.7 kJ
- At the crossing The crossing is 25 m ahead and the car stops in 24.05 m.
- 0.95 m short
- Comparison car The same driver on the same road at 1.2 times the speed: 1.2 times the thinking distance and (1.2)² = 1.44 times the braking distance.
- 32.40 m at 60 km/h
- Comparison at the crossing At 60 km/h it has 13.83 m left to brake in once the driver reacts, so it arrives at √(v² − 2as), with 35% of the kinetic energy it started with.
- 35.4 km/h
A model of the physics, not advice on a safe speed or gap. Real stops vary with tyres, load, brake build-up, ABS on loose surfaces and the driver.
Start from
- Thinking
- Braking
- Stopping distance
- Highway Code totals
- This car, 50 km/h
- Comparison, 60 km/h
- This car, 50 km/h
- Comparison, 60 km/h
Citing this tool
Last updated . Add the date you accessed it as well, which a citation of a page that can change asks for. If a specific result matters, cite the permalink from the tool’s share row instead of this page: it reproduces the exact parameters.
The equation
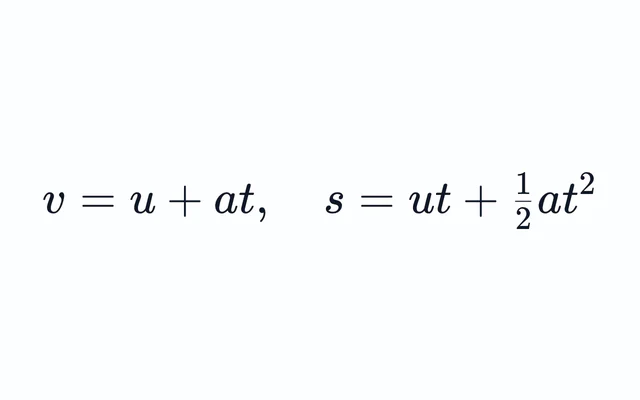
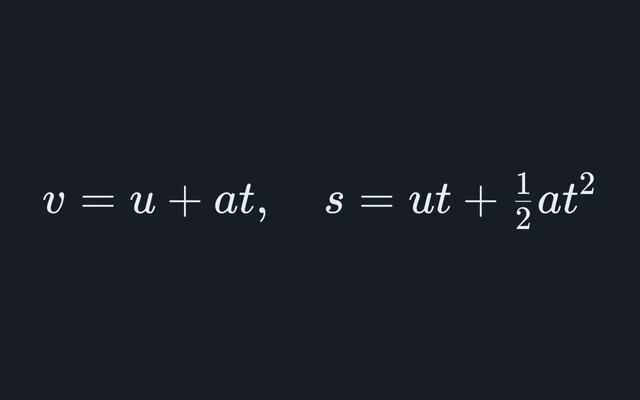
Constant deceleration under tyre friction, v² = u² + 2as
What is the vehicle stopping distance formula?
Total vehicle stopping distance is the sum of thinking distance and braking distance. On a level road: Stopping Distance = (v · tr) + [v2 / (2 · μ · g)], where v is initial speed in m/s, tr is driver reaction time in seconds, μ is tyre-road friction coefficient, and g = 9.81 m/s2 is the acceleration due to gravity.
A stop has two parts. First the driver has to see the hazard and move a foot to the brake, and for that reaction time the car carries on at full speed: the thinking distance, v tr. Then the brakes slow it at a steady deceleration a until it is at rest, and the equation of motion v² = u² + 2as, with a final speed of zero, gives the braking distance, v²/2a. That is the equation the kinematics calculator solves. On a level road the tyres can give a deceleration of at most μg, where μ is the coefficient of friction between tyre and road, so the stopping distance is
S = v t_r + v²/(2μg)
The simulator opens on the Highway Code’s typical car, at 50 km/h with a reaction time of 0.67 s and μ = 0.667. Worked through:
- The speed in metres per second. 50 km/h ÷ 3.6 = 13.89 m/s.
- The thinking distance. 13.89 m/s × 0.67 s = 9.31 m.
- The deceleration. μg = 0.667 × 9.81 m/s² = 6.54 m/s², about two thirds of g.
- The braking distance. (13.89 m/s)² ÷ (2 × 6.54 m/s²) = 14.75 m.
- The stopping distance. 24.05 m, about six car lengths of 4 m. That is the sum of the unrounded parts, 9.306 m and 14.745 m; the rounded figures above add to 24.06 m.
The time to stop is the reaction time plus the braking time, v/a: 0.67 s + 2.12 s = 2.79 s. The simulator’s two cars play that out on the road, the reader’s in the near lane and a comparison car, the same driver 10 km/h faster, in the far lane. The road behind each is painted amber while its driver reacts and red, hatched, while it brakes.
Why speed counts twice
Speed appears once in the thinking distance and twice in the braking distance. Thinking distance grows in proportion to speed, but braking distance grows with its square, because the brakes have to remove the car’s kinetic energy, ½mv², with a friction force that does not grow with speed. That square is the one the kinetic energy calculator shows: twice the speed is four times the energy. So doubling the speed doubles the thinking distance and quadruples the braking distance. At 100 km/h the Highway Code’s car needs 18.61 m of thinking and 58.98 m of braking, 77.59 m in all: 3.2 times as far as at 50 km/h, not twice.
The upper plot draws it. Thinking distance is a straight line and braking distance a curve that bends upwards, and they cross where v tr = v²/2a, at v = 2atr. With the Highway Code’s numbers that is 8.76 m/s, 31.6 km/h: above it, most of any stop is braking.
The crossing makes the same point. At the opening settings the 50 km/h car stops 0.95 m short of the zebra crossing 25 m ahead. The same driver at 60 km/h, a fifth faster, covers 1.86 m more before the brakes come on and needs (60/50)² = 1.44 times the braking distance, 21.23 m against 14.75 m. By the time its driver reacts it has only 13.83 m left in which to brake, and it reaches the crossing still doing 35.4 km/h, with more than a third of the kinetic energy it started with. The momentum calculator gives its momentum at that speed for any mass.
The Highway Code table, rebuilt from two numbers
Rule 126 of the Highway Code gives typical stopping distances from 20 to 70 mph. Its thinking distances are exactly 0.3 m for every mph, which is a reaction time of 0.671 s, and its braking distances are fitted best by a single deceleration of 6.54 m/s². Set UK units, the Highway Code car and 0.67 s, and every row comes back to the metre:
| Speed | Thinking | Braking | Stopping | Car lengths | ||||
|---|---|---|---|---|---|---|---|---|
| Code | Model | Code | Model | Code | Model | Code | Model | |
| 20 mph | 6 | 5.99 | 6 | 6.11 | 12 | 12.10 | 3 | 3.0 |
| 30 mph | 9 | 8.99 | 14 | 13.75 | 23 | 22.73 | 6 | 5.7 |
| 40 mph | 12 | 11.98 | 24 | 24.44 | 36 | 36.42 | 9 | 9.1 |
| 50 mph | 15 | 14.98 | 38 | 38.19 | 53 | 53.17 | 13 | 13.3 |
| 60 mph | 18 | 17.97 | 55 | 54.99 | 73 | 72.97 | 18 | 18.2 |
| 70 mph | 21 | 20.97 | 75 | 74.85 | 96 | 95.82 | 24 | 24.0 |
The Code counts a car as 4 m and calls these distances typical. The same rule says the gap should be at least doubled on wet roads and up to ten times greater on icy roads, and Rule 227 gives the reason for the first: tyres have less grip on a wet road.
Wet, icy and sloping roads
Grip is the coefficient of friction μ, and the simulator’s surfaces take the middle of each range of road adhesion that J. Y. Wong tabulates in Theory of Ground Vehicles. Each surface has two figures: the peak a rolling tyre reaches just before it slips, which ABS holds the tyre at, and the lower sliding value once the wheels lock. At 50 km/h:
| Surface | μ with ABS | Braking with ABS (m) | μ locked | Braking locked (m) |
|---|---|---|---|---|
| Dry asphalt | 0.85 | 11.6 | 0.75 | 13.1 |
| Wet asphalt | 0.60 | 16.4 | 0.53 | 18.6 |
| Gravel | 0.60 | 16.4 | 0.55 | 17.9 |
| Hard-packed snow | 0.20 | 49.2 | 0.15 | 65.6 |
| Ice | 0.10 | 98.4 | 0.07 | 140.5 |
From 11.6 m on dry asphalt, braking with ABS grows to 16.4 m on a wet road and 98.4 m on ice. Locking the wheels costs grip on every one of these surfaces, and a car whose front wheels lock cannot be steered, which is why ABS exists. On loose gravel and fresh snow the order can reverse, because a locked tyre ploughs up a wedge of material ahead of it, which no single coefficient describes.
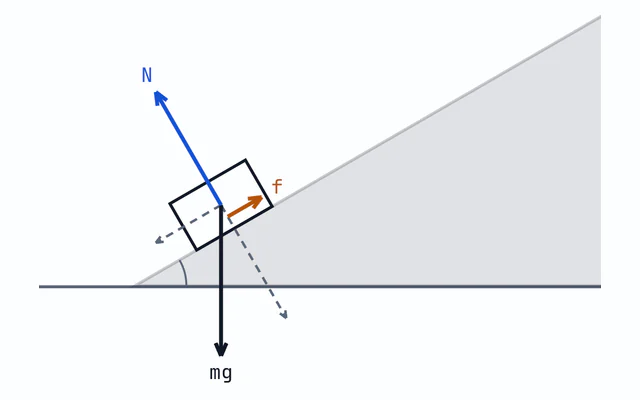
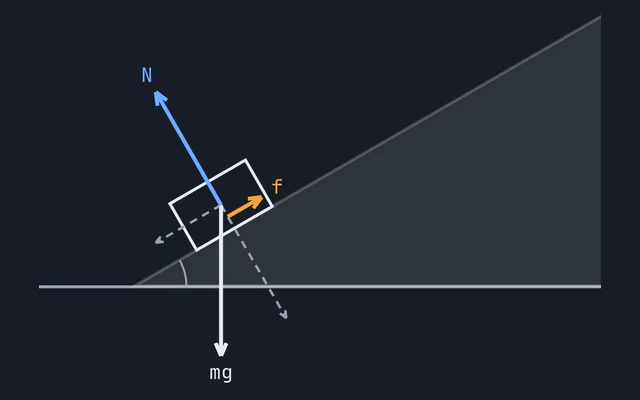
A slope changes the deceleration to g(μ cos θ + sin θ), where tan θ is the grade over 100, uphill positive. Uphill, part of the car’s weight pulls it back and helps the brakes; downhill, it pushes the car on. This is the resolving of forces the inclined plane simulator draws as a free-body diagram. At 50 km/h with the Highway Code’s car, braking takes 14.75 m on the level, 17.43 m down a 10 percent grade and 12.89 m up one.
On ice the effect can be total. With ABS on ice μ is 0.10, and down a 10 percent grade tan θ is 0.10 as well, so μ cos θ equals sin θ and the deceleration is zero: the car slides on at the speed it had, however long the brakes are held. With the wheels locked, μ is 0.07 and the car speeds up. Choose Downhill on ice to watch the first.
Reaction time is not one number
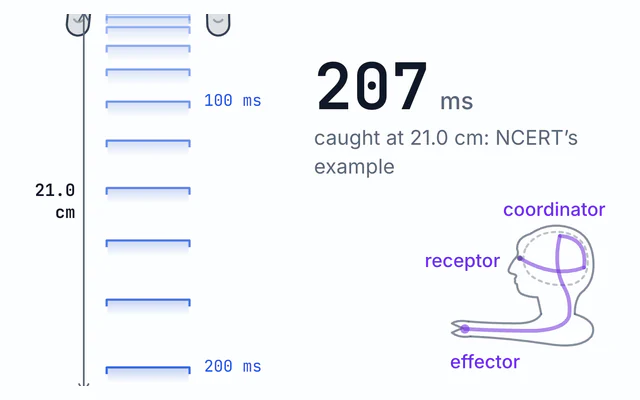
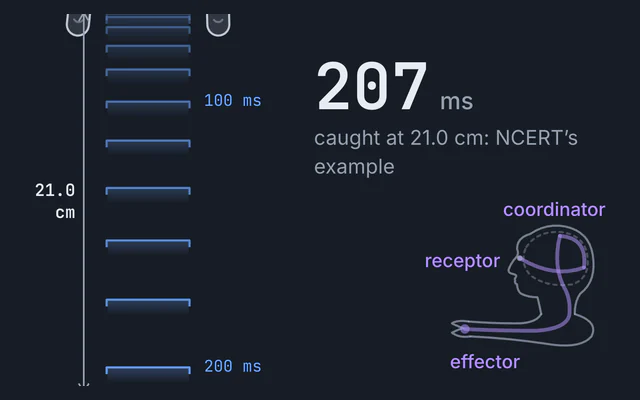
The thinking distance is the reaction time times the speed, so at 50 km/h every tenth of a second costs 1.39 m. A ruler-drop test usually measures about 0.2 s: catch a falling ruler after 21 cm and it fell for 0.21 s. That is a reaction to a signal you were waiting for. Braking for a hazard you did not expect takes longer. In Marc Green’s review of the evidence (Transportation Human Factors, 2000), drivers took about 0.7 s to brake when they expected the signal, about 1.25 s for an unexpected but common one, such as brake lights ahead, and about 1.5 s when surprised. At 50 km/h, 1.5 s is 20.83 m of thinking distance, more than twice the Highway Code’s 9.31 m.
Measure your own with the reaction time ruler-drop experiment, which can send its result here as the reaction time.
Trucks, motorcycles and mass
Mass cancels from the stopping distance. A heavier vehicle presses its tyres onto the road harder, so the most friction they can give, μmg, grows in proportion to its mass, and so does the force it needs to slow down. Switch the vehicle from the car to the motorcycle and every distance stays the same. Only the energy the brakes turn to heat changes, from 144.7 kJ for a nominal 1,500 kg car to 24.1 kJ for a nominal 250 kg motorcycle and rider. The motorcycle has no braking figure of its own here: its deceleration is whatever the grip allows. On the road, Rule 126 of the Highway Code warns that motorcycles, like large vehicles, need a greater distance to stop.
Trucks stop further for a different reason: their brakes, not their tyres, set the limit. US federal rules (FMVSS 121) require most loaded truck tractors to stop from 60 mph within 250 ft, measured from the moment the brake pedal starts to move, an average deceleration of 4.72 m/s², 0.48 g. A few of the heaviest are allowed 310 ft. The rule for cars (FMVSS 135) allows 0.10V + 0.0060V² metres from V km/h, and its V² term is a deceleration of 6.43 m/s², close to the Highway Code’s 6.54. The simulator’s loaded truck brakes no harder than 4.72 m/s² on any surface that grips better than that, so from 60 mph, with the Highway Code’s 0.67 s, it needs 94.17 m, 309 ft, where the Highway Code’s car needs 72.97 m.
Worked exam question: 126 km/h stopped within 200 m
An exercise in NCERT’s Class 11 physics textbook brings a car at 126 km/h to a stop within 200 m and asks for its retardation, taken as uniform, and the time it takes to stop. The question counts only the braking.
- The speed. 126 km/h ÷ 3.6 = 35 m/s.
- The retardation. From v² = u² + 2as with v = 0, a = u²/2s = 35² ÷ (2 × 200) = 3.06 m/s².
- The time. From v = u + at, t = u/a = 35 ÷ 3.0625 = 11.4 s.
Choose Exam: 126 km/h in 200 m to set it up: the braking is worked out from a braking distance of 200 m, the reaction time is 0 s, and the readouts give 3.06 m/s² and 11.4 s. Then give the driver the Highway Code’s 0.67 s to see what a real reaction adds: 23.45 m before the brakes come on.
Reading the two plots
The upper plot is distance against speed for this driver, road and vehicle, from a standstill to the top of the speed slider, with the two cars marked as dots and, when the Highway Code car and 0.67 s are set, the Code’s own totals. The lower plot is speed against time for this stop: flat for the reaction time, then a straight fall to rest, because the deceleration is constant. The area under each line is that car’s stopping distance, the reading of a speed-time graph the motion graphs simulator is built around.
What this model leaves out
- Brake build-up. Real brakes take a fraction of a second to reach full force. The Highway Code’s figures fold that into one average deceleration, and so does this model, which brakes fully the moment the reaction ends.
- Grip that changes with speed. One coefficient serves at every speed. On standing water a tyre can ride up on the water and lose contact, which is aquaplaning, and then no coefficient here describes the stop.
- Brake fade. Long or repeated stops heat the brakes until they grip less, which matters most for loaded trucks on long descents.
- Drag, rolling resistance and engine braking. Each would shorten a stop a little, most at motorway speeds.
- Steering. The vehicle brakes in a straight line. Steering while braking uses grip that the model gives entirely to stopping, and a vehicle that skids sideways is outside it.
- Loose surfaces. On loose gravel and fresh snow, ABS can lengthen a stop rather than shorten it.
Common mistakes
- Leaving the speed in km/h. v²/2a needs metres per second: 50² ÷ (2 × 6.54) gives 191, not 14.75. Divide km/h by 3.6 first.
- Forgetting the thinking distance. At 50 km/h it is 9.31 m of the 24.05 m, more than a third of the stop.
- Expecting twice the speed to need twice the distance. From 50 to 100 km/h the whole stop grows 3.2 times, and the braking part 4 times.
- Using a μ above 1. Ordinary tyres on dry asphalt reach about 0.8 to 0.9. Figures above 1 belong to soft performance and racing tyres.
- Reading a stopping distance as a safe gap. These are the distances of one model vehicle. The Highway Code calls its own figures typical and tells drivers to leave more room in the wet and on ice.
Model and assumptions
- Method
- Exact expression, no time stepping
- Repeatability
- Deterministic. The same link gives the same numbers on any machine.
What it assumes
- The vehicle keeps its speed for the whole reaction time and then brakes at one constant deceleration to rest, so its position and speed are exact expressions in time: v t_r, then v²/2a over v/a seconds.
- Tyre grip is one effective coefficient of friction at every speed, the Amontons and Coulomb law: the brakes take at most μ m g cos θ out of the road, at the peak coefficient while ABS keeps the wheels turning and at the lower sliding one once they lock.
- Full braking starts the instant the reaction ends, because the Highway Code’s figures, which the model reproduces row for row, already fold the brakes’ build-up into one average deceleration.
- The slope is exact, with the grade equal to tan θ: the weight’s component g sin θ adds to the deceleration uphill and takes from it downhill.
- Mass cancels from every distance and time and enters only the energy, ½mv², at nominal masses. Only the loaded truck has brakes of its own, which give no more than FMVSS 121’s average of 4.72 m/s².
- A typed deceleration or braking distance describes a level road, and the comparison car shares the driver’s reaction time and the road’s deceleration.
- A deceleration within a billionth of g of zero counts as zero, since no tyre’s coefficient of friction is known to nine figures, so a car on ice down a slope exactly as steep as its grip slides on at constant speed.
- There is no air resistance, rolling resistance or engine braking, each of which would shorten a stop a little.
Where it stops holding. Grip that changes with speed, as on standing water where a tyre aquaplanes, brakes that fade as they heat, ABS on loose gravel or fresh snow, where a locked tyre can stop shorter, and any vehicle that skids sideways or swerves. A stop in several stages, such as brakes that take time to build up, needs a stage of constant deceleration for each. The Motion Graphs Simulator is the right tool there.
Numerical accuracy
No method error to report: the result is a closed-form expression evaluated directly, with no time stepping to accumulate error. What remains is double-precision rounding, of order one part in 10^16 per operation.
Constants used: Standard gravity (g₀).

Common questions
How do you calculate stopping distance?
Add the thinking distance, the speed times the reaction time, to the braking distance, v²/2a, where the deceleration a is μg on a level road. At 50 km/h, which is 13.9 m/s, with a reaction time of 0.67 s and a deceleration of 6.54 m/s², that is about 9 m of thinking distance and 15 m of braking distance, 24 m in all, or six car lengths. The speed has to be in metres per second: dividing km/h by 3.6 is the step most often missed.
Why does stopping distance grow with the square of speed?
The brakes have to remove the car’s kinetic energy, ½mv², and the friction force doing it does not grow with speed, so the braking distance grows as v². Doubling the speed doubles the thinking distance but quadruples the braking distance. With the Highway Code’s figures, going from 50 to 100 km/h the whole stop grows from 24.1 m to 77.6 m, 3.2 times as far.
What reaction time does the Highway Code use?
Its thinking distances are 0.3 m for every mph, which is a reaction time of 0.67 s, and its braking distances fit a steady deceleration of 6.54 m/s², about two thirds of g. With those two numbers this simulator reproduces every row of the table in Rule 126, from 12 m at 20 mph to 96 m at 70 mph. Real drivers are often slower: about 0.7 s to brake for a hazard they expect and about 1.5 s when surprised (Green, 2000).
How much longer is stopping distance on a wet or icy road?
Tyre grip falls from about 0.8 to 0.9 on dry asphalt to 0.5 to 0.7 when wet and about 0.1 on ice (Wong, Theory of Ground Vehicles). With ABS at 50 km/h, the braking distance goes from 11.6 m dry to 16.4 m wet and 98.4 m on ice. The Highway Code allows more: it says stopping distances are at least double on wet roads, because tyres have less grip, and can be ten times greater on ice.
Does a heavier vehicle take longer to stop?
Not in the friction model. A heavier vehicle presses its tyres onto the road harder, so the most friction they can give grows in proportion to its mass, and so does the force needed to slow it: mass cancels. Real trucks stop further because their brakes reach less deceleration. US rules (FMVSS 121) require most loaded truck tractors to stop from 60 mph within 250 ft, an average of 0.48 g, against about 0.67 g for the Highway Code’s car.
How does a hill change braking distance?
Downhill, part of the car’s weight pushes it on, so the deceleration is g(μ cos θ − sin θ); uphill the weight helps, giving g(μ cos θ + sin θ). At 50 km/h with the Highway Code’s car, a 10 percent downhill stretches braking from 14.7 m to 17.4 m, and a 10 percent climb shortens it to 12.9 m. On ice with ABS, μ is 0.1, and a 10 percent downhill exactly cancels the grip: the car slides on without slowing at all.
How fast does a car reach a hazard it cannot stop for?
After reacting, it brakes over whatever distance s is left before the hazard, so it arrives at √(v² − 2as). At the opening settings the 50 km/h car stops 0.95 m short of a crossing 25 m away, while the same driver at 60 km/h is still doing 35 km/h when it reaches it, with more than a third of its kinetic energy left.