Reaction Time Ruler-Drop Experiment
Test your reaction time with the ruler drop experiment: catch the falling ruler and t = √(2d/g) turns the catch distance into milliseconds, run by run.
Simulator
Press Start, then press Space or a letter key, or tap the stage, the moment the ruler falls.
- Median The middle of your counted catches once they are put in order. Reaction times are lopsided, a few slow ones and many close together, so the median is the fairer centre.
- none yet
- Mean The total of your counted times divided by how many there are.
- none yet
- Spread (SD) The sample standard deviation, s = √(Σ(t − mean)² ÷ (n − 1)), which needs at least two catches.
- none yet
- Best Your fastest counted catch.
- none yet
- Catches 0 counted. Not counted: 0 false starts (pressed before the drop), 0 guesses (under 100 ms) and 0 misses (past the end of the ruler).
- 0 of 0 tries
- Screen refresh From the median time between animation frames. The ruler can only be drawn on a frame, and the screen and your keyboard, mouse or touchscreen add their own delays, commonly tens of milliseconds, which the browser cannot see.
- measuring
Screen times include your display’s and keyboard’s or touchscreen’s own delays, tens of milliseconds the browser cannot see, so they run slower than a real ruler. A demonstration, not a medical or driving test.
- The ruler’s fall, d = ½gt²
- Your counted catches
Citing this tool
Last updated . Add the date you accessed it as well, which a citation of a page that can change asks for. If a specific result matters, cite the permalink from the tool’s share row instead of this page: it reproduces the exact parameters.
On the syllabus: AQA GCSE Required Practicals, Reaction time.
The equation
Galileo, Two New Sciences (1638)
What is the ruler drop reaction time formula?
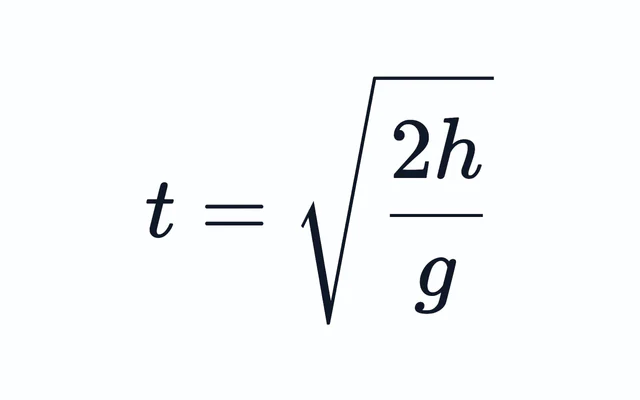
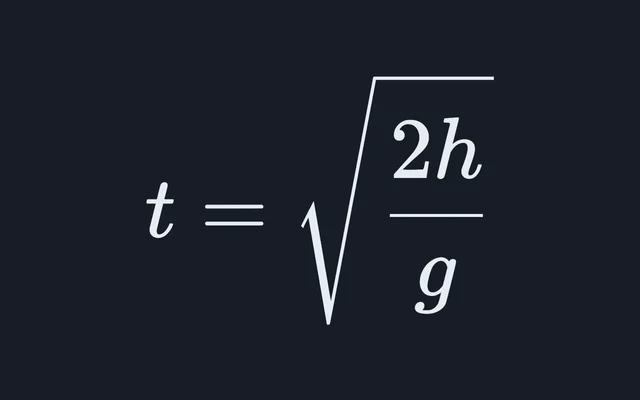
The ruler drop test measures visual reaction time using the physics of free fall under gravity: t = √([2 · d] / g), where t is reaction time in seconds, d is the distance the ruler falls in metres, and g = 9.80665 m/s2 is the acceleration due to gravity.
How a falling ruler measures your reaction time
A ruler that is let go falls from rest, so how far it has dropped by the moment you pinch it depends only
on how long you took: d = ½gt². Turned round, that is t = √(2d/g), and the ruler
becomes its own clock. NCERT’s Class 11 physics textbook works the classic case, a catch at 21.0 cm:
t = √(2 × 0.210 m ÷ 9.80665 m/s²) = 0.207 s, which the book, working with g = 9.8 m/s², calls
about 0.2 s.
The test above runs the same sum the other way. On screen it times you from the frame that shows the ruler let go to your key press or tap, then draws where a real ruler would have been when you caught it. In lab mode you type in the distances from a real ruler instead, and each one becomes a time by t = √(2d/g). Either way the median of your catches is the headline, with every counted catch stacked in the histogram.
The time scale on the ruler
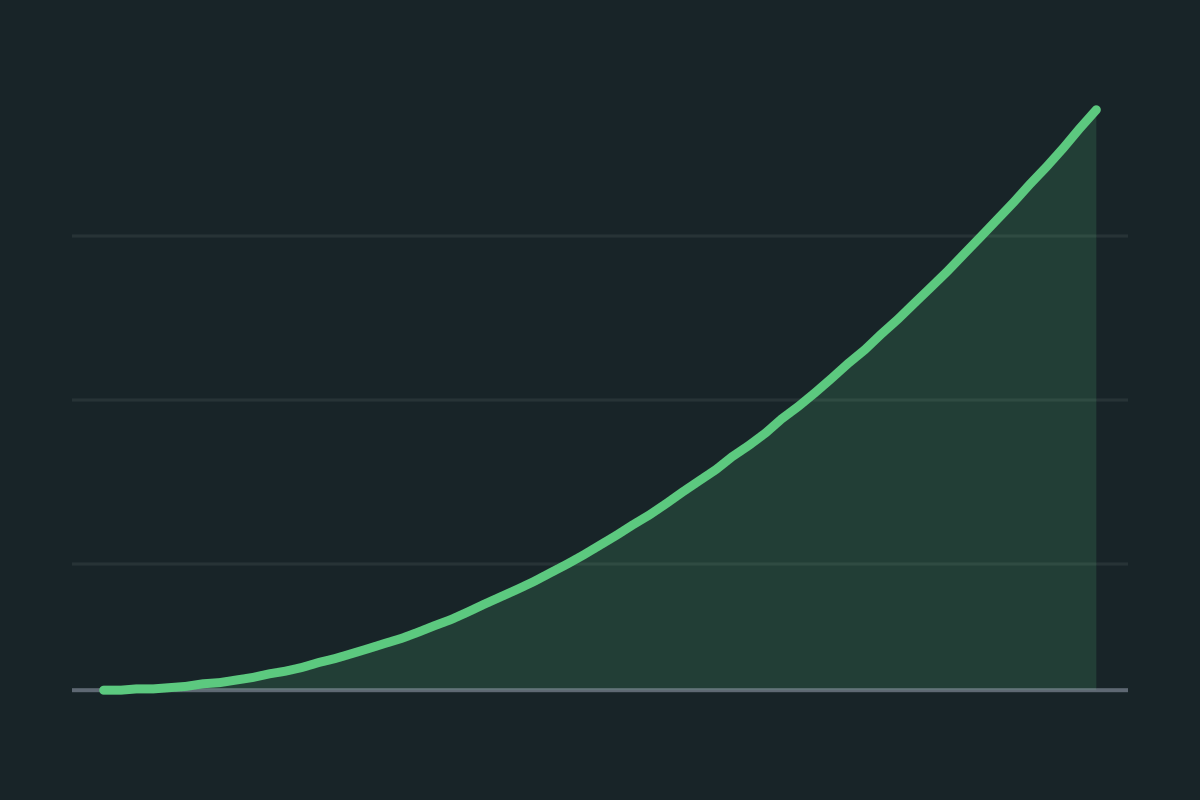
The ruler speeds up as it falls, so equal steps of time are unequal steps of distance. The millisecond
marks down its right edge sit at d = ½gt²: 100 ms at 4.90 cm, 150 ms at 11.03 cm and 200 ms at 19.61 cm,
while 250 ms would sit at 30.65 cm, just past the end of a 30 cm ruler. That is why the marks spread
apart as they climb, and why a 30 cm ruler can time reactions only up to
√(2 × 0.30 m ÷ 9.80665 m/s²) = 0.247 s. A 50 cm ruler reaches 0.319 s and a metre rule 0.452 s.
The spreading also sets how finely a catch can be read. A ruler moving at gt covers g·t millimetres every
millisecond, so one millimetre of reading is worth Δt = Δd ÷ (g·t): 1.02 ms at 0.1 s, 0.51 ms at
0.2 s and 0.34 ms at 0.3 s. Read to the nearest millimetre, a typical catch is good to about half a
millisecond, far finer than the spread from one catch to the next.
| Reaction time | Catch distance | One millimetre is worth |
|---|---|---|
| 50 ms | 1.23 cm | 2.04 ms |
| 100 ms | 4.90 cm | 1.02 ms |
| 150 ms | 11.03 cm | 0.68 ms |
| 200 ms | 19.61 cm | 0.51 ms |
| 240 ms | 28.24 cm | 0.42 ms |
| 247.4 ms, the end | 30.00 cm | 0.41 ms |
The stroboscope shows the same thing from the other side. Its copies of the falling ruler, one every 20 ms, are first 0.20 cm apart, then 0.59, 0.98 and 1.37 cm: gaps growing as 1 : 3 : 5 : 7, the rule of odd numbers Galileo found for anything falling from rest.
What happens in your body between the drop and the catch
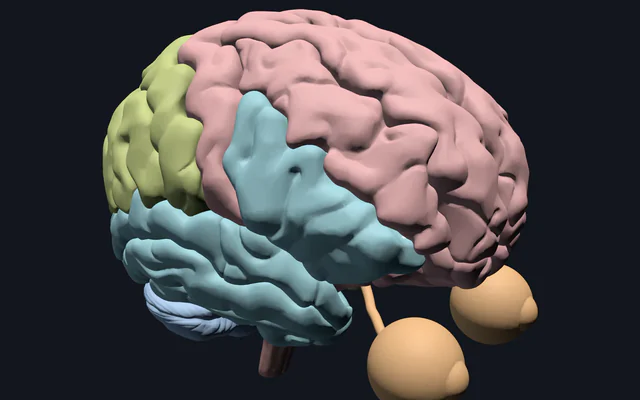
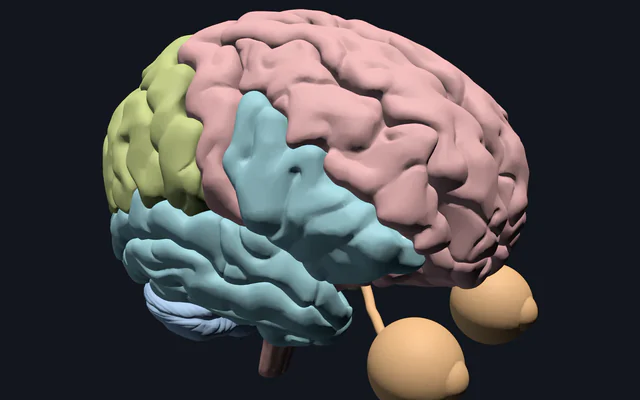
A catch is the chain GCSE biology calls stimulus, receptor, coordinator, effector, response (AQA’s specification 8461, section 4.5.2.1). The stimulus is the ruler starting to move. The receptors are the light-sensitive cells of your retina, which turn the image into nerve impulses. The coordinator is your brain: the visual cortex at the back of it registers that the ruler has moved, and the motor cortex across its top sends the command. The effectors are the muscles of your forearm and hand that close your finger and thumb, and the response is the pinch.
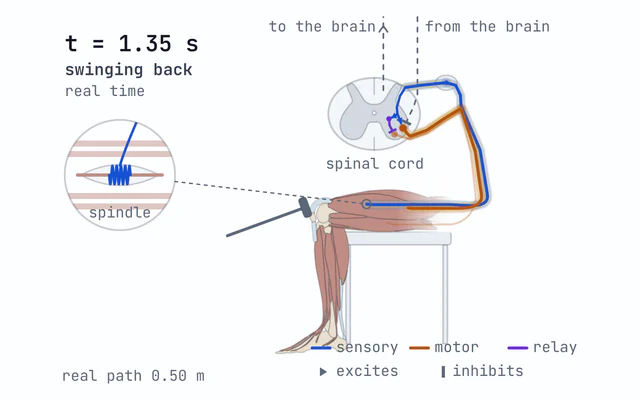
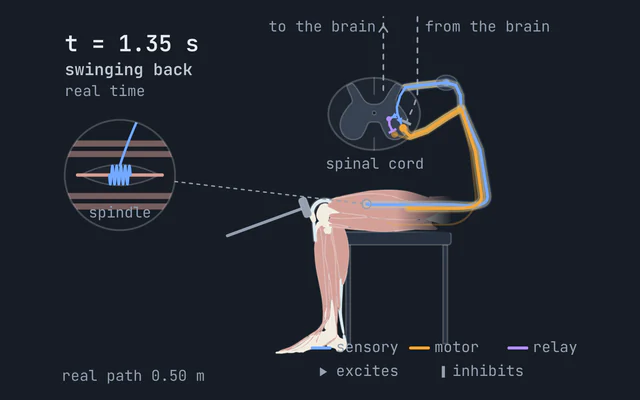
Clinical measurements put rough times on the two ends of that chain. The visual cortex’s main response to a sudden change in a pattern is named P100 for its typical peak, about 100 ms after the change (the ISCEV standard for visual evoked potentials, Šuštar Habjan and colleagues, 2025). A command from the motor cortex reaches the hand muscles in about 20 ms (the IFCN report on brain stimulation, Rossini and colleagues, 2015). Out of a 200 ms catch, then, the two ends take about 120 ms, and the other 80 ms or so goes on the brain deciding that the ruler has gone and preparing the movement, and on the muscles closing the fingers. The drawing on the stage follows the signal from eye to brain to spinal cord to fingers. It is a schematic built on typical published figures, not a measurement of you, and it shows why a catch under 100 ms cannot be a reaction: by then the visual cortex’s main response has not even peaked, let alone become a command to the fingers.
Along each nerve the signal travels as action potentials, brief reversals of the voltage across a nerve cell’s membrane, which the action potential simulator shows in a squid’s giant axon. The visual cortex sits in the occipital lobe and the motor cortex in the precentral gyrus of the 3D brain explorer, and the muscles that close a pinch, the flexors of the forearm and the small muscles of the hand, are in the upper limb muscles explorer. Even inside the muscle a few milliseconds pass between the signal and the first rise in force, the latent period that starts every twitch in the muscle twitch simulator.
A reflex is quicker because it leaves the deciding out. The knee jerk’s signal runs from a stretch receptor to the spinal cord and straight back to the thigh muscle, and reflex actions, as the same specification puts it, “do not involve the conscious part of the brain”. The reflex arc simulator times one on the same millisecond clock.
Why screen tests run slower than a real ruler
A screen can show the drop only on its next frame, which comes every 16.7 ms on a 60 Hz display and every 8.3 ms at 120 Hz, and the frame reaches your eyes some time after the browser starts drawing it. Your press then has to pass through the keyboard, mouse or touchscreen and the operating system before the page hears of it. The browser stamps the frame when it starts drawing it and the press when the system reports it, so the display’s delay and the input device’s are inside every time it measures, and invisible to it.
How much that adds depends on the hardware. Bridges and colleagues (2020) timed ten experiment packages with a robot pressing a fast response box and found that browser-based studies measured response times between about 8 and 67 ms too long, depending on the package, the browser and the operating system, and that an ordinary USB keyboard can add 20 to 40 ms more. So on-screen times here are best compared with each other, before and after a change, on the same device. Distances typed in from a real ruler carry none of that lag, which makes lab mode the way to compare with a classmate or with published figures.
The Screen refresh readout gives your display’s rate, measured from the frames themselves. Times are shown to the whole millisecond, because browsers deliberately blur their clocks, to a tenth of a millisecond or a whole one, and a reaction varies by far more than that from one catch to the next.
Doing the real experiment
The ruler drop is a ready-made way to do GCSE biology’s reaction time practical, AQA’s required practical 7: “plan and carry out an investigation into the effect of a factor on human reaction time”. You need a partner and a 30 cm ruler.
- Your partner holds the ruler upright by its top end, with the zero mark level with the gap between your open thumb and first finger, a finger’s width apart and not touching it.
- Rest your forearm on the edge of a table so that only your fingers move, and watch the ruler, not the hand holding it.
- Without warning, your partner lets go. Catch it as quickly as you can.
- Read the mark at the pinch line, the same line you lined the zero up with, and write it down.
- Repeat at least ten times, with a different wait before each drop so that you cannot anticipate it.
Keep everything else the same: the hand, the ruler, the starting gap, the light and the person dropping. Do a few practice catches first, so that learning the task is not mistaken for the effect you are measuring, and leave out any catch where you moved before the ruler did. Then switch the tool to lab mode and type in your distances. Each one converts as you type, the readouts and the histogram update, and the link holds your readings, so a class can share a set. Compare conditions by their medians.
From catching a ruler to braking a car
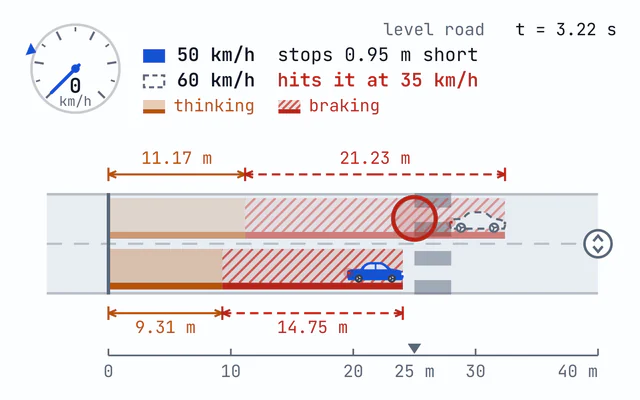
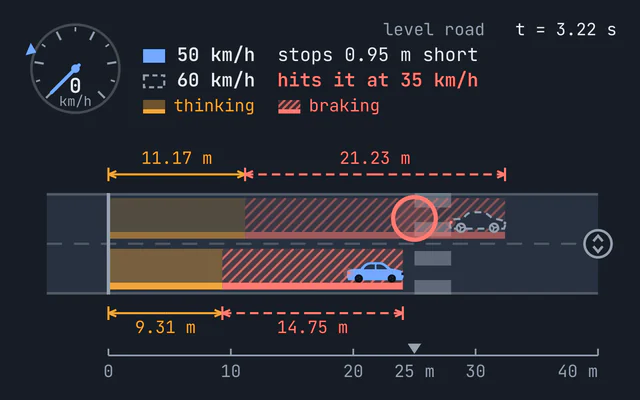
A ruler catch is a reaction to a signal you are watching for and expecting. Braking at the wheel is a different task. Marc Green’s review of driver brake reaction times (2000) puts it at about 0.7 s for a driver who expects to brake, about 1.25 s for an unexpected but common signal such as brake lights ahead, and about 1.5 s for a surprise. The Highway Code’s table of stopping distances assumes 0.67 s, which is its thinking distance of 0.3 m for every mile an hour.
At 50 km/h, 13.9 m/s, a car covers 13.9 m every second before the brakes even start to work. A 0.21 s catch is 2.9 m of that, the Highway Code’s 0.67 s is 9.3 m, and a surprised driver’s 1.5 s is 20.8 m. Once you have three catches, the link beside the results sends your median to the stopping distance simulator to put on a road.
The same catch on the Moon and Mars
Your reaction does not change off Earth, but the ruler does. Lunar gravity is 1.62 m/s², so in 0.2 s a
ruler falls only ½ × 1.62 m/s² × (0.2 s)² = 0.0324 m, 3.24 cm, against 19.61 cm on Earth and
7.46 cm on Mars, where g is 3.73 m/s². The time scale crowds towards the zero end, and a 30 cm ruler, which
runs out at 0.247 s on Earth, can time reactions up to 0.609 s on the Moon. Switch the gravity above to
see it, or work the same fall for any height in the free fall
calculator.
A demonstration, not a medical test
This is a tool for learning about reaction time and free fall. It is not a medical, fitness or driving test, and it does not rank anyone. Sleep, practice and attention all change a result, and an on-screen time also depends on the device it was measured on. Your times stay in this page while it is open and are not sent anywhere; the link holds only your settings and any distances you type in lab mode.
Common mistakes
- Averaging with the mean. Reaction times are lopsided: most catches bunch together and the odd distracted one is much slower. Ten catches of 200 ms and one of 400 ms have a median of 200 ms but a mean of 218 ms. Quote the median, as the readouts do.
- Keeping false starts and guesses. A catch before the ruler moves, or within 100 ms of it, is a guess at when it will drop, not a reaction to it. Leave those out, as the tool does, and count them separately.
- Using g = 10. It makes every time 0.97 percent too short, because √(9.80665 ÷ 10) = 0.990: 2 ms on a 200 ms catch. Use 9.81 m/s².
- Reading the top of your finger instead of the pinch line. Line the zero up with the pinch line, between your finger and thumb, and read the catch at the same line. Reading the top edge of your finger adds its thickness, a centimetre or so, to every catch: about 5 ms at 20 cm.
- Treating the distance as proportional to the time. The ruler starts from rest and speeds up, so the distance grows with the square of the time. Twice the catch distance is not twice the reaction time: 20 cm is 202 ms, and 10 cm is 143 ms, not 101.
- Comparing on-screen times with laboratory figures. Every on-screen time includes the display’s and the input device’s delays. Compare them with each other on the same device, and use real ruler catches for anything else.
Model and assumptions
- Method
- Exact expression, no time stepping
- Repeatability
- Random. A shared link reproduces the settings, not the particular run.
What it assumes
- The ruler falls from rest under uniform gravity with no air resistance, so after a time t it has fallen d = ½gt², and every catch converts by t = √(2d/g). At the end of a 30 cm ruler it moves at 2.4 m/s, where the drag on a ruler falling edge first is well under 1 percent of its weight.
- The thumb and finger start level with the zero mark and close at once, so the mark at the pinch line is the distance the ruler fell before the press.
- On screen a time runs from the timestamp of the animation frame that first draws the ruler released to the timestamp of the key press or tap, both on the browser’s one clock, so the display’s and the input device’s own delays, commonly tens of milliseconds, are inside every time and cannot be taken out.
- Each drop waits a random time, uniform between 1 and 4 s, so it cannot be anticipated, and that wait also nudges the times as it does in the real test. A shared link reproduces the settings and any typed distances, never a run.
- A press before the drop is a false start and has no time, one within 100 ms of the drop is a guess, and one after the ruler has passed its end is a miss. Only the other catches enter the median, the mean, the spread and the best.
Where it stops holding. Comparing on-screen times with published laboratory norms, which include no device lag, and any fall long enough, or any object light enough, for air resistance to matter, as it does for a ball dropped through metres rather than a ruler through centimetres. The Free Fall Calculator is the right tool there.
Numerical accuracy
No time stepping, so nothing accumulates: the ruler’s position in every frame is d = ½gt² at that frame’s timestamp, and every typed distance converts by t = √(2d/g), exact to rounding. The on-screen times are measurements rather than calculations, and two things make them approximate that no model can remove. The release can only be drawn on a frame, so it is timed from the start of the frame that first shows it, one frame being 16.7 ms on a 60 Hz screen and 8.3 ms at 120 Hz, and the screen shows that frame some time later. And every time includes the display’s delay in showing the frame and the keyboard’s, mouse’s or touchscreen’s in reporting the press, commonly tens of milliseconds, which the browser cannot see. The refresh rate shown is the median interval between frames.
Constants used: Standard gravity (g₀).
Common questions
How does the ruler drop test measure reaction time?
The ruler falls from rest, so the distance it drops before you catch it is d = ½gt². Turning that round gives t = √(2d/g). A catch at 21.0 cm, the example in NCERT’s Class 11 physics, is 0.207 s. The ruler itself is the clock.
What is a normal reaction time?
For a simple reaction to something you are waiting for, about 0.2 s. Reviews put college-age adults near 190 ms for a light and 160 ms for a sound (Kosinski, Clemson University). A ruler catch of 15 to 25 cm is 175 to 226 ms. This is not a medical test, and sleep, practice and attention all change the result.
Why is my on-screen reaction time slower than with a real ruler?
The screen can only draw the release on its next frame, every 16.7 ms on a 60 Hz display. The display then takes time to show it, and the keyboard, mouse or touchscreen takes time to report your press. Together that is commonly tens of milliseconds: a 2020 timing study by Bridges and colleagues found browser experiments measuring response times 8 to 67 ms too long, even with a fast response box. The browser cannot see any of it, so every on-screen result runs a little long. Catch distances typed in from a real ruler have none of it.
Why does a 30 cm ruler only measure up to about a quarter of a second?
Because the ruler is still accelerating: it covers 30 cm in √(2 × 0.30 ÷ 9.81) = 0.247 s, and anything slower falls off the end. The same acceleration is why the millisecond marks spread apart along the ruler, from 4.9 cm at 100 ms to 19.6 cm at 200 ms, with the 250 ms mark just past the end at 30.6 cm. A metre rule reaches 0.452 s.
What happens in your body between seeing the ruler drop and catching it?
The retina (the receptor) turns the image into nerve signals. The brain (the coordinator) recognises the movement and sends a command, and motor neurones carry it down the spinal cord and arm to the finger muscles (the effectors). The visual cortex’s main response to a change peaks about 100 ms later (ISCEV standard), and a command from the motor cortex reaches the hand muscles in about 20 ms. Of a 200 ms catch, that leaves about 80 ms for the brain to decide and prepare to act, and for the fingers to close.
Why does the tool report the median rather than the mean?
Reaction times are lopsided. Most catches cluster together, and the odd distracted one is much slower. The median is unaffected by how slow that one was, while the mean is dragged up by it. Ten catches of 200 ms and one of 400 ms have a median of 200 ms and a mean of 218 ms.
Is my ruler reaction time the same as my braking time when driving?
No. A ruler catch is a reaction to a signal you are waiting for. Braking takes most drivers about 0.7 s when they expect to brake and about 1.5 s when surprised (Green, 2000), and the Highway Code’s stopping distances assume 0.67 s. At 50 km/h a 0.21 s catch covers 2.9 m, against 9.3 m at the Highway Code’s 0.67 s, before the brakes even start working.