Maximum heart rate: 220 − age vs Tanaka vs Gellish, with Karvonen zones
220 − age and Tanaka’s 208 − 0.7 × age cross at 40, both 180 bpm; Gellish’s 207 − 0.7 × age runs 1 bpm under Tanaka. At 20, 220 − age gives 200 against Tanaka’s 194, and at 70, 150 against 159. For a 70-year-old, the vigorous percent-of-maximum zone is 116 to 142 bpm by 220 − age and 123 to 151 by Tanaka.
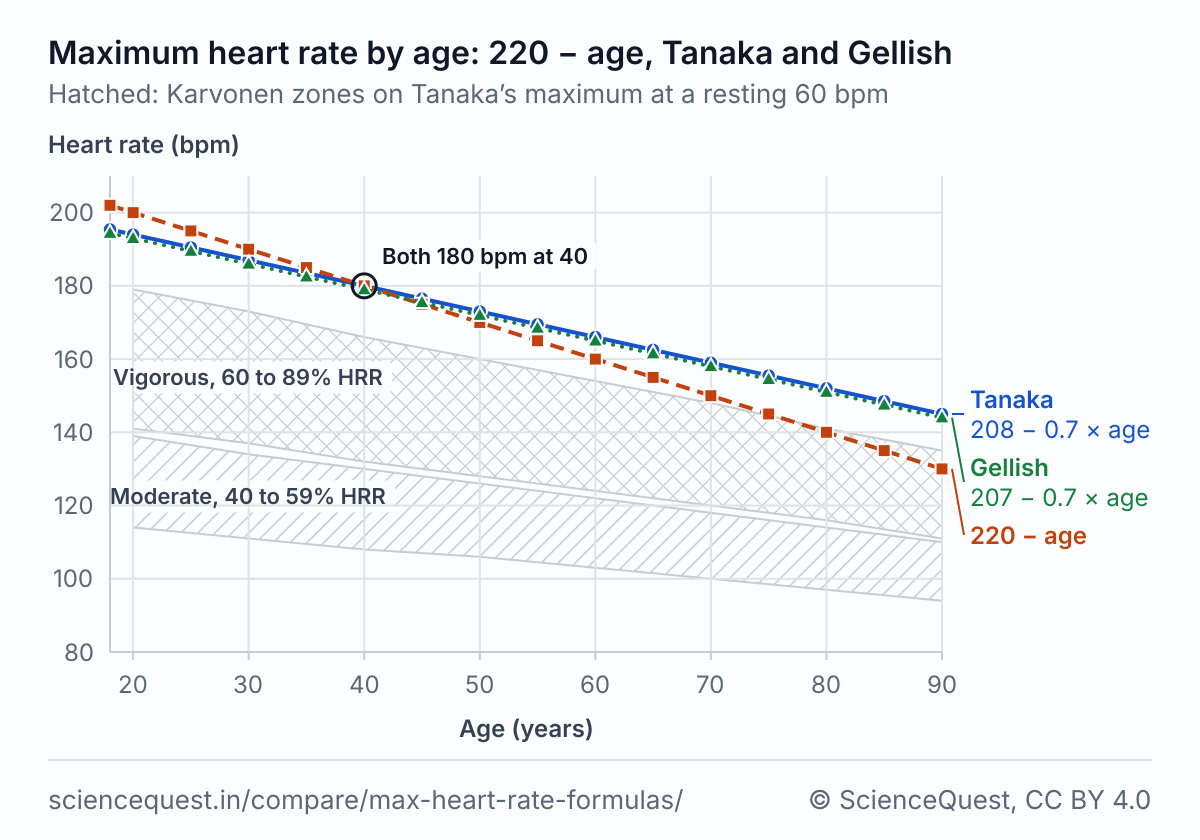
Maximum heart rate by age
| Age (years) | 220 − age | Tanaka, 208 − 0.7 × age | Gellish, 207 − 0.7 × age | 220 − age above Tanaka |
|---|---|---|---|---|
| 18 | 202 | 195.4 | 194.4 | +6.6 |
| 20 | 200 | 194.0 | 193.0 | +6.0 |
| 25 | 195 | 190.5 | 189.5 | +4.5 |
| 30 | 190 | 187.0 | 186.0 | +3.0 |
| 35 | 185 | 183.5 | 182.5 | +1.5 |
| 40 | 180 | 180.0 | 179.0 | 0.0 |
| 45 | 175 | 176.5 | 175.5 | −1.5 |
| 50 | 170 | 173.0 | 172.0 | −3.0 |
| 55 | 165 | 169.5 | 168.5 | −4.5 |
| 60 | 160 | 166.0 | 165.0 | −6.0 |
| 65 | 155 | 162.5 | 161.5 | −7.5 |
| 70 | 150 | 159.0 | 158.0 | −9.0 |
| 75 | 145 | 155.5 | 154.5 | −10.5 |
| 80 | 140 | 152.0 | 151.0 | −12.0 |
| 85 | 135 | 148.5 | 147.5 | −13.5 |
| 90 | 130 | 145.0 | 144.0 | −15.0 |
Karvonen zones on Tanaka’s maximum
| Age (years) | Resting 60 bpm, % of reserve | Resting 75 bpm, % of reserve | ||
|---|---|---|---|---|
| Moderate, 40 to 59% | Vigorous, 60 to 89% | Moderate, 40 to 59% | Vigorous, 60 to 89% | |
| 20 | 114 to 139 | 141 to 179 | 123 to 145 | 147 to 180 |
| 30 | 111 to 134 | 137 to 173 | 120 to 141 | 143 to 174 |
| 40 | 108 to 130 | 132 to 166 | 117 to 136 | 138 to 168 |
| 50 | 106 to 126 | 128 to 160 | 115 to 132 | 134 to 162 |
| 60 | 103 to 122 | 124 to 154 | 112 to 128 | 130 to 155 |
| 70 | 100 to 118 | 120 to 148 | 109 to 124 | 126 to 149 |
| 80 | 97 to 114 | 116 to 141 | 106 to 120 | 122 to 143 |
| 90 | 94 to 110 | 111 to 135 | 103 to 116 | 117 to 137 |
A resting rate 15 bpm higher lifts the 40 percent edge by 9 bpm and the 89 percent edge by under 2, since Karvonen’s target is intensity × HRmax plus (1 − intensity) × HRrest. The bands are whole percents, so a beat or two between zones can fall in neither: 140 bpm at 20 years, resting 60, is 59.7 percent of reserve, which the calculator counts as moderate.
Percent-of-maximum zones under each formula
| Age (years) | Tanaka, % of maximum | 220 − age, % of maximum | ||
|---|---|---|---|---|
| Moderate, 64 to 76% | Vigorous, 77 to 95% | Moderate, 64 to 76% | Vigorous, 77 to 95% | |
| 20 | 125 to 147 | 150 to 184 | 128 to 152 | 154 to 190 |
| 30 | 120 to 142 | 144 to 177 | 122 to 144 | 147 to 180 |
| 40 | 116 to 136 | 139 to 171 | 116 to 136 | 139 to 171 |
| 50 | 111 to 131 | 134 to 164 | 109 to 129 | 131 to 161 |
| 60 | 107 to 126 | 128 to 157 | 103 to 121 | 124 to 152 |
| 70 | 102 to 120 | 123 to 151 | 96 to 114 | 116 to 142 |
| 80 | 98 to 115 | 118 to 144 | 90 to 106 | 108 to 133 |
| 90 | 93 to 110 | 112 to 137 | 84 to 98 | 101 to 123 |
The bands stop at 76 and start again at 77 percent, so a beat or two between them is in neither: at 70 on Tanaka, 121 bpm is 76.1 percent and 122 bpm is 76.7 percent of maximum. The calculator gives such a figure without naming a band.
Why the formulas disagree
Robergs and Landwehr traced 220 − age to a 1971 review by Fox, Naughton and Haskell, who set the line by eye through about 35 data points and fitted no regression. Their figure legend says the line runs “not far from many of the data points”. Robergs and Landwehr refitted those points and got 215.4 − 0.9147 × age, with r = 0.51 and a standard error of 21 bpm.
Tanaka’s group and Gellish’s reached the same slope by different routes. Tanaka, Monahan and Seals pooled group means from 351 studies; Gellish and colleagues followed 132 people through 908 exercise tests over 25 years. Their lines sit 1 bpm apart. 220 − age drops 1 bpm a year against their 0.7 bpm, so it parts from Tanaka by 3 bpm for every decade away from 40 and runs 15 bpm under at 90.
The 9 bpm gap at 70 is about the size of the error in any age-only estimate. Robergs and Landwehr report standard errors of 7 to 11 bpm across two decades of studies, so for one person a maximum measured on an exercise test is the better figure. At 70, resting at 60 bpm, Karvonen’s vigorous zone is 120 to 148 bpm on Tanaka’s maximum and 114 to 140 bpm on 220 − age.
The formulas
Where each formula holds
| Formula | Fitted in | Holds for | Not for |
|---|---|---|---|
| Tanaka, 208 − 0.7 × age | Healthy adults: 18,712 people in 351 pooled studies, checked on 514 measured in one laboratory | The average maximum of healthy adults, the population the paper names; no sex or activity correction needed | One person’s true maximum, children, or people outside the healthy adults it was fitted to, such as those on beta blockers or with heart disease |
| Gellish, 207 − 0.7 × age | 132 adults of both sexes and a broad range of ages and fitness, 908 maximal exercise tests at one university fitness centre from 1978 to 2003, fitted with linear mixed models | A longitudinal check on Tanaka: the same slope, 1 bpm lower | One person’s true maximum, children, or a maximum lowered by medication |
| 220 − age | Not fitted: set by eye through about 35 points in a 1971 review (Fox, Naughton and Haskell); a regression on those points gives 215.4 − 0.9147 × age, r = 0.51 (Robergs and Landwehr 2002) | Reading older charts; within 3 bpm of Tanaka from 30 to 50 | Older adults, where it runs low: 9 bpm under Tanaka at 70 |
| Karvonen, heart rate reserve | A 1957 longitudinal training study (Karvonen, Kentala and Mustala); the bands are ACSM’s | A resting rate measured at rest, with the reserve bands | Percent-of-maximum bands: the two scales have different edges |
| Percent of maximum | ACSM classification of relative intensity (Garber 2011) | The percent-of-maximum bands only | Reserve bands, or a maximum lowered by medication |
Calculators and simulators
Sources
- Tanaka H, Monahan KD, Seals DR. Age-predicted maximal heart rate revisited. Journal of the American College of Cardiology 2001;37(1):153 to 156. doi:10.1016/S0735-1097(00)01054-8
- Gellish RL, Goslin BR, Olson RE, McDonald A, Russi GD, Moudgil VK. Longitudinal modeling of the relationship between age and maximal heart rate. Medicine and Science in Sports and Exercise 2007;39(5):822 to 829. doi:10.1097/mss.0b013e31803349c6
- Fox SM 3rd, Naughton JP, Haskell WL. Physical activity and the prevention of coronary heart disease. Annals of Clinical Research 1971;3(6):404 to 432. https://pubmed.ncbi.nlm.nih.gov/4945367/
- Robergs RA, Landwehr R. The surprising history of the “HRmax=220-age” equation. Journal of Exercise Physiology Online 2002;5(2):1 to 10. https://www.asep.org/asep/asep/Robergs2.pdf
- Karvonen MJ, Kentala E, Mustala O. The effects of training on heart rate; a longitudinal study. Annales Medicinae Experimentalis et Biologiae Fenniae 1957;35(3):307 to 315. https://pubmed.ncbi.nlm.nih.gov/13470504/
- Garber CE, Blissmer B, Deschenes MR, et al. American College of Sports Medicine position stand: quantity and quality of exercise for developing and maintaining cardiorespiratory, musculoskeletal, and neuromotor fitness in apparently healthy adults: guidance for prescribing exercise. Medicine and Science in Sports and Exercise 2011;43(7):1334 to 1359. The band edges are the ones the site’s target heart rate calculator uses, which it takes from Table 6.1 of ACSM’s Guidelines for Exercise Testing and Prescription, 10th edition (2018). doi:10.1249/MSS.0b013e318213fefb
The values are facts and free to use; this table’s selection and presentation are © 2026 ScienceQuest.