One-rep max formulas compared: Epley vs Brzycki vs Lombardi
Lifted for 10 reps, 100 kg gives a one-rep max of 133.3 kg by Epley and 133.4 kg by Brzycki, but 125.9 kg by Lombardi. At 5 reps Brzycki is lowest: 112.5 kg against 116.7 by Epley and 117.5 by Lombardi. At 15 reps Brzycki’s multiplier of 1.6372 sits 24.9 percent above Lombardi’s 1.3110.
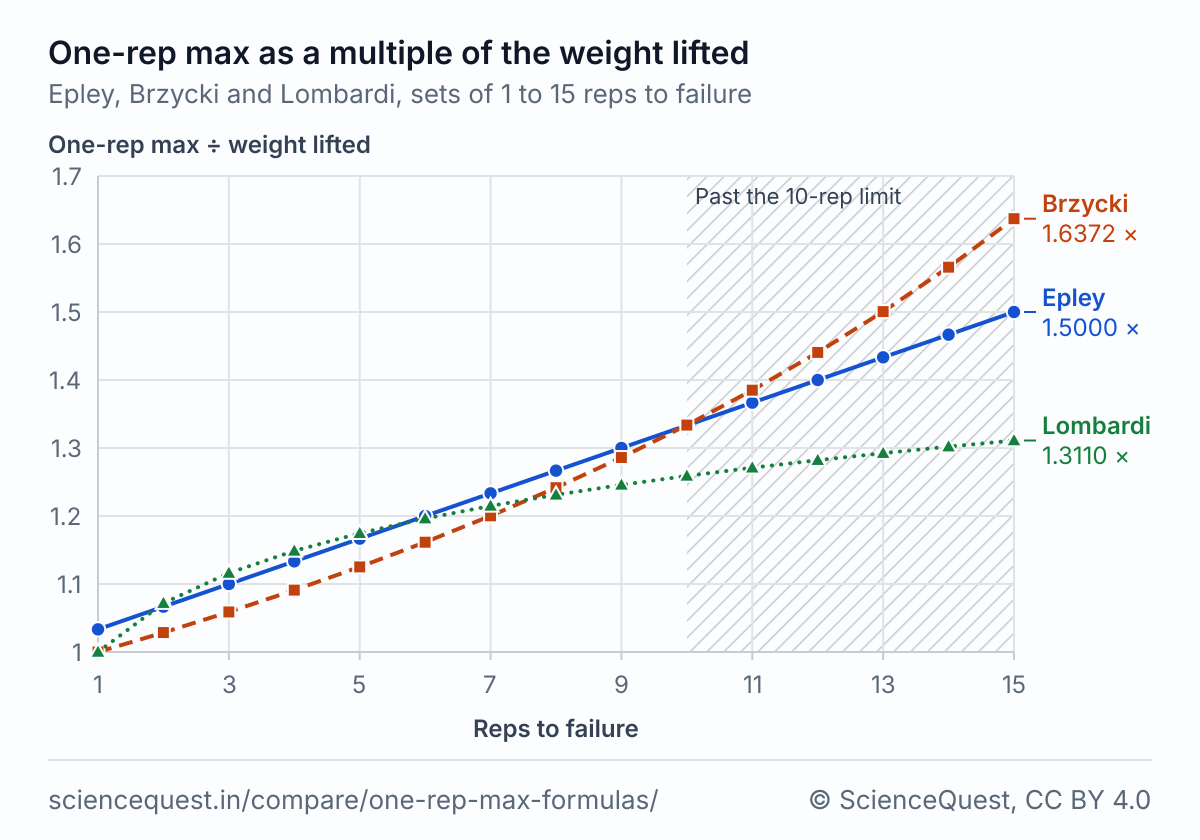
One-rep max as a multiple of the weight lifted
| Reps | Epley × | Brzycki × | Lombardi × | Spread % |
|---|---|---|---|---|
| 1 | 1.0333 | 1.0000 | 1.0000 | 3.3 |
| 2 | 1.0667 | 1.0286 | 1.0718 | 4.2 |
| 3 | 1.1000 | 1.0589 | 1.1161 | 5.4 |
| 4 | 1.1333 | 1.0910 | 1.1487 | 5.3 |
| 5 | 1.1667 | 1.1251 | 1.1746 | 4.4 |
| 6 | 1.2000 | 1.1614 | 1.1962 | 3.3 |
| 7 | 1.2333 | 1.2002 | 1.2148 | 2.8 |
| 8 | 1.2667 | 1.2416 | 1.2311 | 2.9 |
| 9 | 1.3000 | 1.2860 | 1.2457 | 4.4 |
| 10 | 1.3333 | 1.3337 | 1.2589 | 5.9 |
| 11 | 1.3667 | 1.3850 | 1.2710 | 9.0 |
| 12 | 1.4000 | 1.4405 | 1.2821 | 12.4 |
| 13 | 1.4333 | 1.5006 | 1.2924 | 16.1 |
| 14 | 1.4667 | 1.5659 | 1.3020 | 20.3 |
| 15 | 1.5000 | 1.6372 | 1.3110 | 24.9 |
Multiply the weight you lifted by the figure in your row. The spread is the highest estimate over the lowest, less one. Rows 11 to 15, hatched in the chart, lie past the 10-rep limit that studies of Brzycki’s equation keep to (Abdul-Hameed and colleagues 2012); the one rep max calculator answers up to 15 reps and refuses more.
Estimated one-rep max from 100 kg and from 225 lb
| Reps | 100 kg lifted | 225 lb lifted | ||||
|---|---|---|---|---|---|---|
| Epley kg | Brzycki kg | Lombardi kg | Epley lb | Brzycki lb | Lombardi lb | |
| 1 | 103.3 | 100.0 | 100.0 | 232.5 | 225.0 | 225.0 |
| 2 | 106.7 | 102.9 | 107.2 | 240.0 | 231.4 | 241.1 |
| 3 | 110.0 | 105.9 | 111.6 | 247.5 | 238.2 | 251.1 |
| 4 | 113.3 | 109.1 | 114.9 | 255.0 | 245.5 | 258.5 |
| 5 | 116.7 | 112.5 | 117.5 | 262.5 | 253.2 | 264.3 |
| 6 | 120.0 | 116.1 | 119.6 | 270.0 | 261.3 | 269.2 |
| 7 | 123.3 | 120.0 | 121.5 | 277.5 | 270.0 | 273.3 |
| 8 | 126.7 | 124.2 | 123.1 | 285.0 | 279.4 | 277.0 |
| 9 | 130.0 | 128.6 | 124.6 | 292.5 | 289.4 | 280.3 |
| 10 | 133.3 | 133.4 | 125.9 | 300.0 | 300.1 | 283.3 |
| 11 | 136.7 | 138.5 | 127.1 | 307.5 | 311.6 | 286.0 |
| 12 | 140.0 | 144.1 | 128.2 | 315.0 | 324.1 | 288.5 |
The formulas are ratios, so any load scales the same way: 225 lb for 5 reps is 262.5 lb by Epley.
Percent of one-rep max for each rep count
| Reps | Epley | Brzycki | Lombardi |
|---|---|---|---|
| 1 | 96.8 | 100.0 | 100.0 |
| 2 | 93.8 | 97.2 | 93.3 |
| 3 | 90.9 | 94.4 | 89.6 |
| 4 | 88.2 | 91.7 | 87.1 |
| 5 | 85.7 | 88.9 | 85.1 |
| 6 | 83.3 | 86.1 | 83.6 |
| 7 | 81.1 | 83.3 | 82.3 |
| 8 | 78.9 | 80.5 | 81.2 |
| 9 | 76.9 | 77.8 | 80.3 |
| 10 | 75.0 | 75.0 | 79.4 |
| 11 | 73.2 | 72.2 | 78.7 |
| 12 | 71.4 | 69.4 | 78.0 |
This is the lifting percentage chart: 100 divided by the multiplier. Epley’s line puts a single at 96.8 percent because it adds a thirtieth even to one rep; the calculator’s own chart counts a single as 100 percent.
Why the formulas disagree
Epley adds 1/30 of the weight for every rep, a straight line. Brzycki puts the weight you can lift for r reps at 102.78 percent of your max less 2.78 percent for each rep, and dividing by that falling line bends his multiplier upward. Lombardi raises the reps to the power 0.10, which climbs most over the first few reps and then flattens.
From 1 to 10 reps they stay within 5.9 percent of each other and sit closest at 7 reps, 2.8 percent apart. Brzycki gives the lowest estimate from 2 to 7 reps and Lombardi from 8 reps on. Epley and Brzycki both put a 10-rep set at 75.0 percent of the max, so at 10 reps they agree to 0.03 percent. Brzycki’s printed 1.0278 and 0.0278 are 37/36 and 1/36 rounded to four places. Written with those fractions, as 36 ÷ (37 − r), his line meets Epley’s at exactly 10 reps, so the rounding alone separates Epley’s 133.3 kg from Brzycki’s 133.4 kg in the answer.
Past 10 reps Brzycki’s curve climbs away from Epley’s line and Lombardi’s flattens below both, so the spread reaches 12.4 percent at 12 reps and 24.9 percent at 15. All three assume you took the set to failure. Stop with reps in hand and you enter fewer reps than you could do, and every estimate comes out low. Natera and colleagues (2024), citing LeSuer and colleagues (1997) among others, add that the exercise and the equipment change how valid an estimate is, a back squat against a leg press or a free bar against a Smith machine, and so do the lifter’s sex, age and training history.
The formulas
Where each formula holds
| Formula | Fitted in | Holds for | Not for |
|---|---|---|---|
| Epley | Not fitted to a reported sample: a poundage chart in Boyd Epley Workout (1985), which Richens and Cleather (2014) call “not based on scientific research” | No rep limit in a source read for this page; the page applies the 10-rep limit found for Brzycki’s equation to all three | A single, which it puts at 1.0333 times the weight; sets past 10 reps |
| Brzycki | Not fitted to a reported sample: a JOPERD article (1993) that, Richens and Cleather (2014) note, “does not say on what information this equation is based” | Sets of 1 to 10 reps to failure: Abdul-Hameed and colleagues (2012) limit a bench press validity study in men, and their own test-retest study of five lifts in middle-aged adults with type 2 diabetes, to 10 reps | Sets past 10 reps, where it rises fastest; it divides by zero near 37 reps (36.97) |
| Lombardi | No sample reported in a source read for this page: a power law in Beginning Weight Training (1989), a textbook | None given in a source read for this page; the page uses the same 10-rep limit | Sets past 10 reps, where the three curves separate: 24.9 percent apart at 15, with Lombardi lowest at 1.3110 times |
Calculators and simulators
Sources
- Epley B. Poundage chart. In: Boyd Epley Workout. Lincoln, NE: Body Enterprises; 1985: 86. The book has no DOI, and no Open Library or Crossref record. Equation as printed, 1RM = load × (1 + 0.0333 × reps), in Macarilla CT, et al. Accuracy of predicting one-repetition maximum from submaximal velocity in the barbell back squat and bench press. Journal of Human Kinetics 2022;82:201-212. https://doi.org/10.2478/hukin-2022-0046
- Brzycki M. Strength testing: predicting a one-rep max from reps-to-fatigue. Journal of Physical Education, Recreation and Dance 1993;64(1):88-90. doi:10.1080/07303084.1993.10606684
- Lombardi VP. Beginning Weight Training: The Safe and Effective Way. Dubuque, IA: Wm. C. Brown; 1989. ISBN 0697054969. The book is not online. Equation as printed, 1RM = weight × reps^0.1, in Table 1 (from LeSuer and colleagues 1997) of Lin TY, et al. The effects of barbell resistance exercise on information processing speed and conflict-related ERP in older adults: a crossover randomized controlled trial. Scientific Reports 2021;11:9137. https://doi.org/10.1038/s41598-021-88634-5
- Abdul-Hameed U, Rangra P, Shareef MY, Hussain ME. Reliability of 1-repetition maximum estimation for upper and lower body muscular strength measurement in untrained middle aged type 2 diabetic patients. Asian Journal of Sports Medicine 2012;3(4):267-273. Prints Brzycki’s coefficients as 102.78 and 2.78 and gives the 10-rep limit. doi:10.5812/asjsm.34549
- Richens B, Cleather DJ. The relationship between the number of repetitions performed at given intensities is different in endurance and strength trained athletes. Biology of Sport 2014;31(2):157-161. Table 1 says what Epley’s and Brzycki’s equations rest on. doi:10.5604/20831862.1099047
- Natera AO, Chapman DW, Chapman ND, Keogh JWL. Predicting repeat power ability through common field assessments: is repeat power ability a unique physical quality? PeerJ 2024;12:e16788. On how the exercise, the equipment and the lifter change an estimate’s validity. doi:10.7717/peerj.16788
The values are facts and free to use; this table’s selection and presentation are © 2026 ScienceQuest.