Stopping distance chart: by speed, road surface and reaction time
At 60 mph a driver who takes 1.5 s to react needs 274 ft to stop on dry asphalt, 333 ft on wet asphalt and 1,335 ft on ice. On dry asphalt 132 ft of that passes before the brakes act. A loaded truck tractor at the FMVSS 121 limit needs 382 ft.
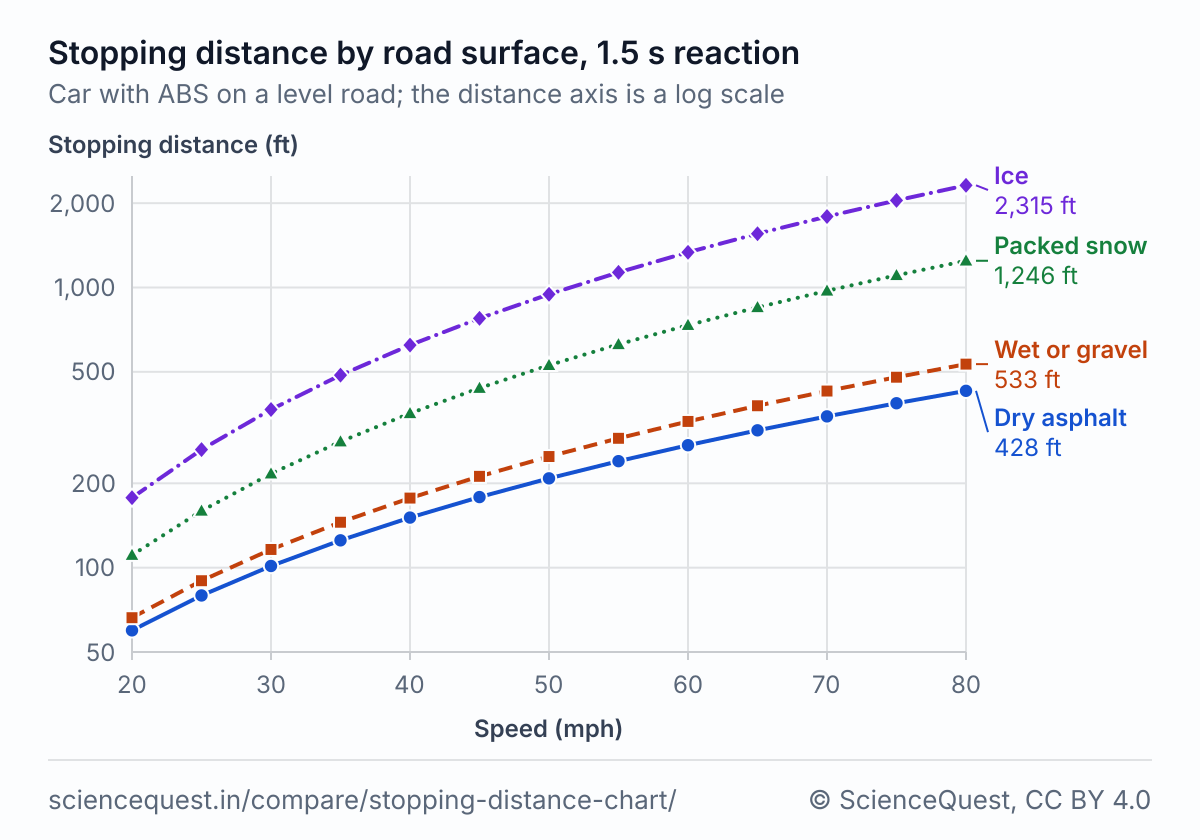
Stopping distance by speed and road surface, 1.5 s reaction
| Speed (mph) | Dry asphalt | Wet asphalt | Gravel | Hard-packed snow | Ice |
|---|---|---|---|---|---|
| 20 | 60 | 66 | 66 | 111 | 178 |
| 25 | 80 | 90 | 90 | 159 | 264 |
| 30 | 101 | 116 | 116 | 216 | 367 |
| 35 | 125 | 145 | 145 | 282 | 487 |
| 40 | 151 | 177 | 177 | 355 | 623 |
| 45 | 179 | 212 | 212 | 437 | 776 |
| 50 | 208 | 249 | 249 | 528 | 946 |
| 55 | 240 | 290 | 290 | 627 | 1,132 |
| 60 | 274 | 333 | 333 | 734 | 1,335 |
| 65 | 309 | 378 | 378 | 849 | 1,555 |
| 70 | 347 | 427 | 427 | 973 | 1,792 |
| 75 | 386 | 478 | 478 | 1,105 | 2,045 |
| 80 | 428 | 533 | 533 | 1,246 | 2,315 |
At 60 mph (96.6 km/h) the same stops measure 83.4 m on dry asphalt, 101.4 m on wet asphalt or gravel, 223.6 m on hard-packed snow and 407.0 m on ice. Wet asphalt’s peak range in the Army handbook’s table, 0.5 to 0.7, centers on gravel’s 0.6 [1], so their columns match.
Thinking and braking distance on dry asphalt at three reaction times
| Speed (mph) | Braking | 0.67 s, Highway Code | 1.5 s, surprised driver | 2.5 s, US road design | |||
|---|---|---|---|---|---|---|---|
| Any reaction time | Thinking | Stopping | Thinking | Stopping | Thinking | Stopping | |
| 20 | 16 | 20 | 35 | 44 | 60 | 73 | 89 |
| 25 | 25 | 25 | 49 | 55 | 80 | 92 | 116 |
| 30 | 35 | 29 | 65 | 66 | 101 | 110 | 145 |
| 35 | 48 | 34 | 83 | 77 | 125 | 128 | 177 |
| 40 | 63 | 39 | 102 | 88 | 151 | 147 | 210 |
| 45 | 80 | 44 | 124 | 99 | 179 | 165 | 245 |
| 50 | 98 | 49 | 147 | 110 | 208 | 183 | 282 |
| 55 | 119 | 54 | 173 | 121 | 240 | 202 | 321 |
| 60 | 142 | 59 | 201 | 132 | 274 | 220 | 362 |
| 65 | 166 | 64 | 230 | 143 | 309 | 238 | 404 |
| 70 | 193 | 69 | 261 | 154 | 347 | 257 | 449 |
| 75 | 221 | 74 | 295 | 165 | 386 | 275 | 496 |
| 80 | 252 | 79 | 330 | 176 | 428 | 293 | 545 |
Thinking distance is the speed times the reaction time: each mph covers 1.47 ft a second. The thinking part is the larger one only at 20 mph at 0.67 s, up to 55 mph at 1.5 s and at every speed here at 2.5 s. Each stopping figure is rounded from the exact sum, so it can differ by 1 ft from the two printed parts added.
Braking from 60 mph: ABS against locked wheels
| Surface | With ABS | Wheels locked | Extra | ||
|---|---|---|---|---|---|
| μ | Braking ft | μ | Braking ft | Longer % | |
| Dry asphalt | 0.85 | 142 | 0.75 | 160 | 13 |
| Wet asphalt | 0.60 | 201 | 0.53 | 227 | 13 |
| Gravel | 0.60 | 201 | 0.55 | 219 | 9 |
| Hard-packed snow | 0.20 | 602 | 0.15 | 802 | 33 |
| Ice | 0.10 | 1,203 | 0.07 | 1,719 | 43 |
Braking distance goes as one over μ, so the locked stop is longer by the ratio of the two coefficients. The ABS column assumes the system holds each tire at its peak μ for the whole stop, the best case.
A car and a loaded truck tractor from 60 mph
| Vehicle | Deceleration | Distance (ft) | ||
|---|---|---|---|---|
| ft/s² | g | Braking | With 1.5 s | |
| Car, FMVSS 135 | 21.1 | 0.66 | 184 | 316 |
| Car, dry asphalt | 27.3 | 0.85 | 142 | 274 |
| Tractor, FMVSS 121 | 15.5 | 0.48 | 250 | 382 |
FMVSS 135 tests a new light vehicle from 100 km/h (62.1 mph), which must stop within 70 m (230 ft) on a surface with a peak friction coefficient of 1.02 [3]. The rate is the V² term of its limit; the 0.10 V term adds 0.36 s at full speed, 32 ft from 60 mph, for a whole limit of 215 ft. FMVSS 121 measures from the moment the brake control starts to move, and allows 310 ft for the heavier tractors in its column 4 and 310 ft for loaded single-unit trucks in column 2 [4].
These figures model one vehicle on a level road, for study. For a following gap, Rule 126 of the Highway Code asks for at least two seconds on high-speed roads and in tunnels, doubled on wet roads and up to ten times on icy ones [2].
Why the distances differ
During the reaction time the car holds its speed, so the thinking distance grows in step with speed; the brakes then take the speed off at one steady rate, and the braking distance grows with its square [5]. On dry asphalt with a 1.5 s reaction, going from 30 to 60 mph doubles the thinking distance from 66 to 132 ft and multiplies the braking by four, from 35 to 142 ft. The whole stop grows 2.7 times, from 101 to 274 ft.
The Highway Code’s thinking distances work out to 0.67 s [2], a driver ready to brake. Marc Green’s summary of his 2000 paper [6] puts an expected brake at about 0.7 s, an unexpected but common signal such as brake lights at about 1.25 s, and a surprise from the side at about 1.5 s, perhaps a few tenths less for an obstacle straight ahead [7]. US road designers plan for 2.5 s: AASHO, AASHTO’s forerunner, adopted it in 1954, and NCHRP Report 400 found it at the 90th to 95th percentile after recording 45 drivers in 3,000 braking maneuvers [5]. At 60 mph, 2.5 s covers 220 ft before the brakes act, more than the 142 ft the car then needs on dry asphalt.
Grip sets the braking part. The middle of the ranges in a US Army design handbook’s table of tire friction is 0.85 on dry asphalt and 0.60 wet, and its figure for ice is 0.10 [1]. Braking distance goes as one over μ, so from 60 mph a car with ABS needs 142 ft dry, 201 ft wet and 1,203 ft on ice. Locked wheels brake at the lower coefficient of sliding friction instead [1], which adds 9 to 43 percent. A loaded truck tractor meets FMVSS 121 if it stops from 60 mph within 250 ft [4], an average of 0.48 g. The model lets the tractor’s brakes set that limit on any road that grips better, so on dry asphalt the tractor needs 108 ft more than the car.
The formulas
- Stopping distance (v in m/s, t in s, a in m/s²) [5]
-
- Deceleration from the tires’ grip on a level road [1]
-
- FMVSS 135 stopping limit (S in m, V in km/h) and its rate [3]
-
- FMVSS 121 loaded truck tractor rate [4]
-
g = 9.80665 m/s², standard gravity. 1 ft = 0.3048 m and 1 mile = 1,609.344 m, both exact. The tractor brakes at the lower of μg and its 4.72 m/s².
Where each figure holds
| Model or figure | Based on | Holds for | Not for |
|---|---|---|---|
| Stopping distance, thinking plus braking | Full speed for the reaction time, then one constant deceleration to rest: AASHTO’s stopping sight distance model, here on the level [5] | A level road (grade 0), braking in a straight line, one μ at every speed, from the moment the driver sees the hazard | Hills, which the simulator handles; drag and rolling resistance, which the model leaves out; brakes that build up slowly or fade; standing water, where a tire can aquaplane |
| The Army handbook’s tire friction coefficients | Representative values for rubber tires on each pavement, after Taborek (1957): static friction, the peak, for the most braking force a wheel can give, and sliding friction once the wheels lock; the middle of each range (wet asphalt’s sliding 0.45 to 0.6 taken as 0.53) [1] | Comparing road surfaces for rubber tires, as the table’s representative values | One tire on one road, which can sit well away from either figure: the handbook calls it “almost impossible to standardize coefficient-of-friction values” [1]; an ABS that does not hold the tires at their peak for the whole stop |
| Reaction times of 0.67 s, 1.5 s and 2.5 s | 0.67 s rebuilds the Highway Code’s thinking distances [2]; 1.5 s is Green’s best estimate for a surprise from the side, with one straight ahead perhaps a few tenths faster [7]; 2.5 s is AASHTO’s design value, a 90th to 95th percentile in NCHRP Report 400’s tests [5] | A ready driver, a surprised one, and the slow driver US roads are designed for | Any one driver: Green writes that “there can be no single, universal reaction time value” [7] |
| FMVSS 135 rate, 6.43 m/s² | The V² term of the limit for a new light vehicle, tested from 100 km/h on a surface with a peak friction coefficient of 1.02 [3] | The least braking a new US car or light truck must reach in the test | Roads with less grip than the test surface; the limit’s 0.10 V term, 0.36 s at full speed, which the rate leaves out |
| FMVSS 121 limit, 4.72 m/s² | Table II, column 3: loaded tractors with two axles, or with three and a GVWR of 70,000 lb or less, or with four or more and 85,000 lb or less, tested with an unbraked control trailer, from 60 mph within 250 ft [4] | A loaded truck tractor that just meets the rule, on a road that grips at least as well as its brakes pull | The heavier tractors of column 4, allowed 310 ft; loaded single-unit trucks, allowed 310 ft (column 2); brake fade on long descents; ice and snow, where the tires’ grip falls below the brakes’ rate |
Calculators and simulators
Sources
- US Army Materiel Command. Engineering Design Handbook, Automotive Series: The Automotive Assembly, AMCP 706-355. Washington, DC, : Table 5-1, coefficients of static and sliding friction for rubber tires on pavements, after Taborek (1957), p. 5-11, and equations 5-48 and 5-49 on braking, p. 5-22. DTIC AD0830268, read at the Internet Archive. https://archive.org/details/DTIC_AD0830268, read
- Department for Transport. The Highway Code, rule 126, Stopping distances, and its Typical stopping distances diagram. gov.uk. https://www.gov.uk/guidance/the-highway-code/general-rules-techniques-and-advice-for-all-drivers-and-riders-103-to-158, read
- 49 CFR 571.135, Federal Motor Vehicle Safety Standard No. 135, Light vehicle brake systems: S4, stopping distance, and S7.5, cold effectiveness. eCFR, current to . https://www.ecfr.gov/current/title-49/subtitle-B/chapter-V/part-571/subpart-B/section-571.135, read
- 49 CFR 571.121, Federal Motor Vehicle Safety Standard No. 121, Air brake systems: S5.3.1 and Table II, stopping distance in feet. eCFR, current to . https://www.ecfr.gov/current/title-49/subtitle-B/chapter-V/part-571/subpart-B/section-571.121, read
- Fambro DB, Fitzpatrick K, Koppa RJ. NCHRP Report 400: Determination of Stopping Sight Distances. Washington, DC: Transportation Research Board, National Academy Press, 1997: equation 3, p. 9, and pp. 3 and 10. https://onlinepubs.trb.org/onlinepubs/nchrp/nchrp_rpt_400.pdf, read
- Green M. “How long does it take to stop?” Methodological analysis of driver perception-brake times. Transportation Human Factors 2000;2(3):195 to 216. doi:10.1207/STHF0203_1
- Green M. Driver Reaction Time. visualexpert.com: the author’s summary of the 2000 paper. https://www.visualexpert.com/Resources/reactiontime.html, read
The values are facts and free to use; this table’s selection and presentation are © 2026 ScienceQuest.