A-a gradient by age: (age + 10) ÷ 4, age ÷ 4 + 4 and Mellemgaard, with alveolar oxygen in high US cities
At 70 the expected A-a gradient is 20.0 mmHg by (age + 10) ÷ 4, the calculator’s estimate, 21.5 by age ÷ 4 + 4 and 17.2 by Mellemgaard’s 2.5 + 0.21 × age. Moving from sea level to Colorado Springs lowers the expected PaO2 more than ageing from 20 to 90: room-air PAO2 falls 31.7 mmHg, while (age + 10) ÷ 4 rises 17.5.
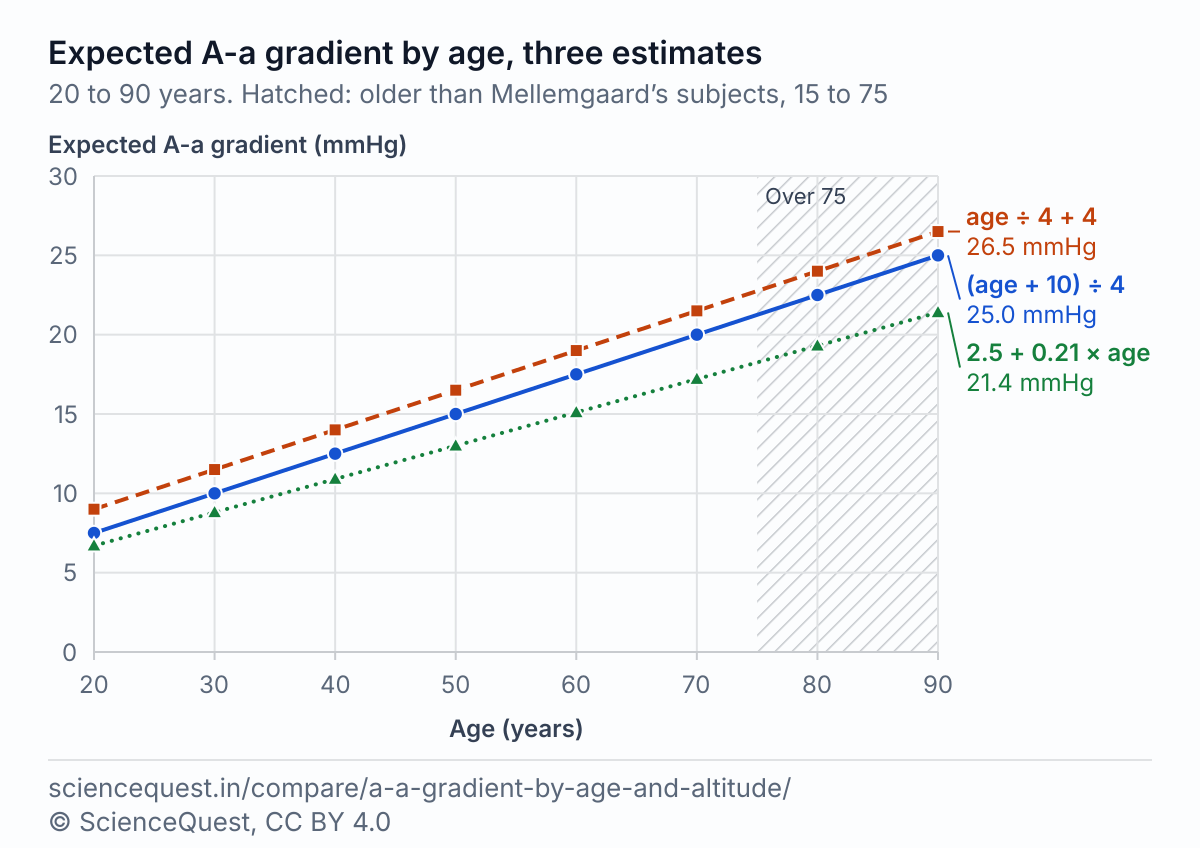
Expected A-a gradient by age
| Age (years) | (age + 10) ÷ 4 | age ÷ 4 + 4 | 2.5 + 0.21 × age | Difference |
|---|---|---|---|---|
| 20 | 7.5 | 9.0 | 6.7 | 0.8 |
| 30 | 10.0 | 11.5 | 8.8 | 1.2 |
| 40 | 12.5 | 14.0 | 10.9 | 1.6 |
| 50 | 15.0 | 16.5 | 13.0 | 2.0 |
| 60 | 17.5 | 19.0 | 15.1 | 2.4 |
| 70 | 20.0 | 21.5 | 17.2 | 2.8 |
| 80 | 22.5 | 24.0 | 19.3† | 3.2† |
| 90 | 25.0 | 26.5 | 21.4† | 3.6† |
The difference is (age + 10) ÷ 4 less 2.5 + 0.21 × age. At every age, age ÷ 4 + 4 runs 1.5 mmHg above (age + 10) ÷ 4. † Older than Mellemgaard’s 80 subjects, who were 15 to 75.
Alveolar oxygen in the high US cities
| Place | Elevation ft | Pressure mmHg | PiO2 mmHg | PAO2 mmHg |
|---|---|---|---|---|
| Sea level | 0 | 760.0 | 149.7 | 99.7 |
| Colorado Springs, CO | 6,009 | 608.9 | 118.0 | 68.0 |
| Aurora, CO | 5,405 | 622.9 | 120.9 | 70.9 |
| Denver, CO | 5,276 | 625.9 | 121.6 | 71.6 |
| Albuquerque, NM | 4,955 | 633.5 | 123.2 | 73.2 |
| El Paso, TX | 3,713 | 663.4 | 129.4 | 79.4 |
| Tucson, AZ | 2,481 | 694.3 | 135.9 | 85.9 |
| Las Vegas, NV | 1,996 | 706.8 | 138.6 | 88.6 |
| Mesa, AZ | 1,242 | 726.5 | 142.7 | 92.7 |
| Oklahoma City, OK | 1,196 | 727.7 | 143.0 | 93.0 |
| Phoenix, AZ | 1,088 | 730.6 | 143.6 | 93.6 |
| Omaha, NE | 1,056 | 731.4 | 143.7 | 93.7 |
| Atlanta, GA | 1,050 | 731.6 | 143.8 | 93.8 |
Pressure is the 1976 US Standard Atmosphere at the ground of each city’s USGS point, as on the boiling point by city page. FiO2 21%, water vapour 47 mmHg. A lower PaCO2, usual at altitude, raises PAO2 above these figures.
PaO2 at the expected gradient
| Place | Age 30 | Age 70 | ||||
|---|---|---|---|---|---|---|
| (age + 10) ÷ 4 | age ÷ 4 + 4 | 2.5 + 0.21 × age | (age + 10) ÷ 4 | age ÷ 4 + 4 | 2.5 + 0.21 × age | |
| Sea level | 89.7 | 88.2 | 90.9 | 79.7 | 78.2 | 82.5 |
| Colorado Springs, CO | 58.0 | 56.5 | 59.2 | 48.0 | 46.5 | 50.8 |
| Aurora, CO | 60.9 | 59.4 | 62.1 | 50.9 | 49.4 | 53.7 |
| Denver, CO | 61.6 | 60.1 | 62.8 | 51.6 | 50.1 | 54.4 |
| Albuquerque, NM | 63.2 | 61.7 | 64.4 | 53.2 | 51.7 | 56.0 |
| El Paso, TX | 69.4 | 67.9 | 70.6 | 59.4 | 57.9 | 62.2 |
| Tucson, AZ | 75.9 | 74.4 | 77.1 | 65.9 | 64.4 | 68.7 |
| Las Vegas, NV | 78.6 | 77.1 | 79.8 | 68.6 | 67.1 | 71.4 |
| Mesa, AZ | 82.7 | 81.2 | 83.9 | 72.7 | 71.2 | 75.5 |
| Oklahoma City, OK | 83.0 | 81.5 | 84.2 | 73.0 | 71.5 | 75.8 |
| Phoenix, AZ | 83.6 | 82.1 | 84.8 | 73.6 | 72.1 | 76.4 |
| Omaha, NE | 83.7 | 82.2 | 84.9 | 73.7 | 72.2 | 76.5 |
| Atlanta, GA | 83.8 | 82.3 | 85.0 | 73.8 | 72.3 | 76.6 |
PAO2 from the table before, less the expected gradient at that age: 10.0, 11.5 or 8.8 mmHg at 30; 20.0, 21.5 or 17.2 mmHg at 70, worked before rounding. Mellemgaard’s 2.5 + 0.21 × age is an average, and healthy people fall on both sides of it.
Why the estimates and the cities differ
In healthy lungs the gap between alveolar and arterial oxygen widens with age, and all three lines follow it. StatPearls’ current chapter on the gradient gives (age + 10) ÷ 4, the estimate the calculator reads a gradient against. Its archived chapter gives age ÷ 4 + 4, which has the same slope and sits 1.5 mmHg higher at every age. Both are bedside rules: neither chapter names a sample they were fitted to. Mellemgaard fitted 2.5 + 0.21 × age to 80 healthy seated subjects aged 15 to 75, so his line is their average and healthy people fall on both sides of it: Gold and Koth put the SD around his predicted PaO2 at about 6 mmHg. Against his line, (age + 10) ÷ 4 sits 0.8 mmHg higher at 20 and 3.6 higher at 90.
The alveolar gas equation takes 47 mmHg of water vapour off the barometric pressure, applies the 21% of oxygen to what is left, then subtracts PaCO2 ÷ 0.8. At sea level that gives a PiO2 of 149.7 mmHg and a PAO2 of 99.7. The standard pressure in Denver, 625.9 mmHg, gives a PAO2 of 71.6. Type 760 for a patient in Denver and you invent a gradient of about 28 mmHg in a healthy lung.
At the expected gradient, a 70-year-old in Denver has a PaO2 of 51.6 mmHg by (age + 10) ÷ 4, 50.1 by age ÷ 4 + 4 and 54.4 by Mellemgaard. At sea level the same person has 79.7 by (age + 10) ÷ 4, and a 30-year-old 89.7. People who live high breathe harder and run a lower PaCO2, 30 to 40 mmHg in Salt Lake City against 36 to 44 at sea level by Gold and Koth, so their real PAO2 sits above the table’s.
The formulas
- Alveolar gas equation [1]
-
- A-a gradient [1]
-
- Expected gradient, (age + 10) ÷ 4 [1]
-
- Expected gradient, age ÷ 4 + 4 [2]
-
- Expected gradient, Mellemgaard [5]
-
FiO2 is the inspired fraction, 0.21 on room air; Patm the barometric pressure; 47 mmHg the water vapour pressure at 37 °C; PaCO2 and PaO2 the arterial CO2 and oxygen; R the respiratory quotient, 0.8; age in years. Patm here is the 1976 US Standard Atmosphere at each city’s elevation, as the boiling point by city page gives it: 101.325 kPa, 760.0 mmHg, at sea level.
Where each formula holds
| Formula | Based on | Holds for | Not for |
|---|---|---|---|
| (age + 10) ÷ 4 | No sample reported: StatPearls gives it with no reference beside it | A quick bedside figure for an adult breathing room air, and the one the calculator reads a gradient against | Supplemental oxygen, which widens the expected gradient (Dhont 2020 adds 50 × (FiO2 − 0.21) to age ÷ 4 + 4); altitude, which is no term in it |
| age ÷ 4 + 4 | No sample reported: the archived StatPearls chapter cites Singh 2022, which, like Dhont 2020, uses it without one | A quick bedside figure for an adult breathing room air, 1.5 mmHg more generous than (age + 10) ÷ 4 | Supplemental oxygen, which widens the expected gradient (Dhont 2020 adds 50 × (FiO2 − 0.21)); altitude, which is no term in it |
| 2.5 + 0.21 × age (Mellemgaard 1966) | A regression on 80 healthy seated subjects aged 15 to 75, so their average, with an SD of about 6 mmHg around the predicted PaO2 (Gold and Koth) | Healthy people aged 15 to 75, seated | Ages over 75, marked † in the table; children under 15, younger than anyone in the sample; altitude, which is no term in it |
| Alveolar gas equation | The clinical approximation of the alveolar air equation, with R of about 0.8 (Gold and Koth) | Steady breathing, with PaCO2 standing in for alveolar CO2 | Exact gas exchange work: the precise form, with its correcting factor for R, gives a slightly higher PAO2 on room air; a patient whose R is far from the 0.8 used here, or whose breathing or FiO2 has not settled |
| US Standard Atmosphere, 1976 | An average atmosphere, as on the boiling point by city page | The average pressure at each city’s USGS point | Today’s weather, or a hospital above or below that point: enter the day’s barometric pressure in the calculator |
Calculators and simulators
Related comparisons
Sources
- Hantzidiamantis PJ, Amaro E. Physiology, Alveolar to Arterial Oxygen Gradient. StatPearls. Treasure Island (FL): StatPearls Publishing; updated . NCBI Bookshelf NBK545153, PMID 31424737. It prints PAO2 = (Patm − PH2O) FiO2 − PaCO2/RQ, and “The expected A-a gradient can be estimated with the following equation: A-a gradient = (Age + 10) / 4”. https://www.ncbi.nlm.nih.gov/books/NBK545153/, read
- Pesola GR, Sankari A. Oxygenation Status and Pulse Oximeter Analysis (archived). StatPearls. Treasure Island (FL): StatPearls Publishing; updated . NCBI Bookshelf NBK592401, PMID 37276303. “For older individuals, there are formulas to adjust for age to calculate the A-a difference, such as [A-a difference adjusted for age= A-a difference (age/4) + 4]”, citing Singh 2022. https://www.ncbi.nlm.nih.gov/books/NBK592401/, read
- Singh A, Soni KD, Singh Y, Aggarwal R, Venkateswaran V, Ashar MS, Trikha A. Alveolar arterial gradient and respiratory index in predicting the outcome of COVID-19 patients; a retrospective cross-sectional study. Archives of Academic Emergency Medicine 2022;10(1):e28. Methods: “The expected A-a oxygen gradient for age was derived using the following formula (Age/4) + 4”, with 760, 47 and 0.80 in the gas equation. doi:10.22037/aaem.v10i1.1543, read
- Dhont S, Derom E, Van Braeckel E, Depuydt P, Lambrecht BN. The pathophysiology of ‘happy’ hypoxemia in COVID-19. Respiratory Research 2020;21:198. It relates the gradient to age as age/4 + 4, plus 50 (FiO2 − 0.21) on oxygen. doi:10.1186/s12931-020-01462-5, read
- Mellemgaard K. The alveolar-arterial oxygen difference: its size and components in normal man. Acta Physiologica Scandinavica 1966;67(1):10 to 20. Not readable online; its regression and sample are as Gold and Koth report them. doi:10.1111/j.1748-1716.1966.tb03281.x
- Gold WM, Koth LL. Pulmonary function testing. In: Broaddus VC, Mason RJ, Ernst JD, et al., eds. Murray and Nadel’s Textbook of Respiratory Medicine, 6th edition. Philadelphia: Elsevier Saunders; 2016, chapter 25, 407 to 435. Mellemgaard’s 2.5 + 0.21 × age in 80 healthy seated subjects aged 15 to 75, an SD of about 6 mmHg, the alveolar air equation in its precise and clinical forms, and PaCO2 of 36 to 44 mmHg at sea level against 30 to 40 in Salt Lake City. doi:10.1016/B978-1-4557-3383-5.00025-7, read
- NOAA, NASA and U.S. Air Force (1976). U.S. Standard Atmosphere, 1976. NASA TM-X-74335. https://ntrs.nasa.gov/citations/19770009539
- U.S. Geological Survey, National Geospatial Program (2026). Geographic Names Information System, Federal Codes file, FedCodes_AllStates_Text.zip (published ): each city’s populated place and its official location, NAD83. https://prd-tnm.s3.amazonaws.com/StagedProducts/GeographicNames/FederalCodes/FedCodes_AllStates_Text.zip, read
- U.S. Geological Survey. Elevation Point Query Service, version 1: ground elevation from the 3D Elevation Program at a point, in feet or meters. https://epqs.nationalmap.gov/v1/docs, read
- U.S. Census Bureau, Population Division (2026). Annual Estimates of the Resident Population for Incorporated Places of 20,000 or More, Ranked by July 1, 2025 Population (SUB-IP-EST2025-ANNRNK), and the dataset sub-est2025.csv. https://www.census.gov/data/tables/time-series/demo/popest/2020s-total-cities-and-towns.html, read
The values are facts and free to use; this table’s selection and presentation are © 2026 ScienceQuest.