Boiling point of water in the 50 largest US cities
Water boils at 201.0 °F (93.9 °C) in Colorado Springs, at 6,009 ft the highest of the 50 largest US cities, about 11 °F cooler than at sea level. Next come Aurora (5,405 ft, 202.1 °F), Denver (5,276 ft, 202.3 °F), Albuquerque and El Paso. In the 38 cities below 1,000 ft, water boils at 210.3 °F or hotter.
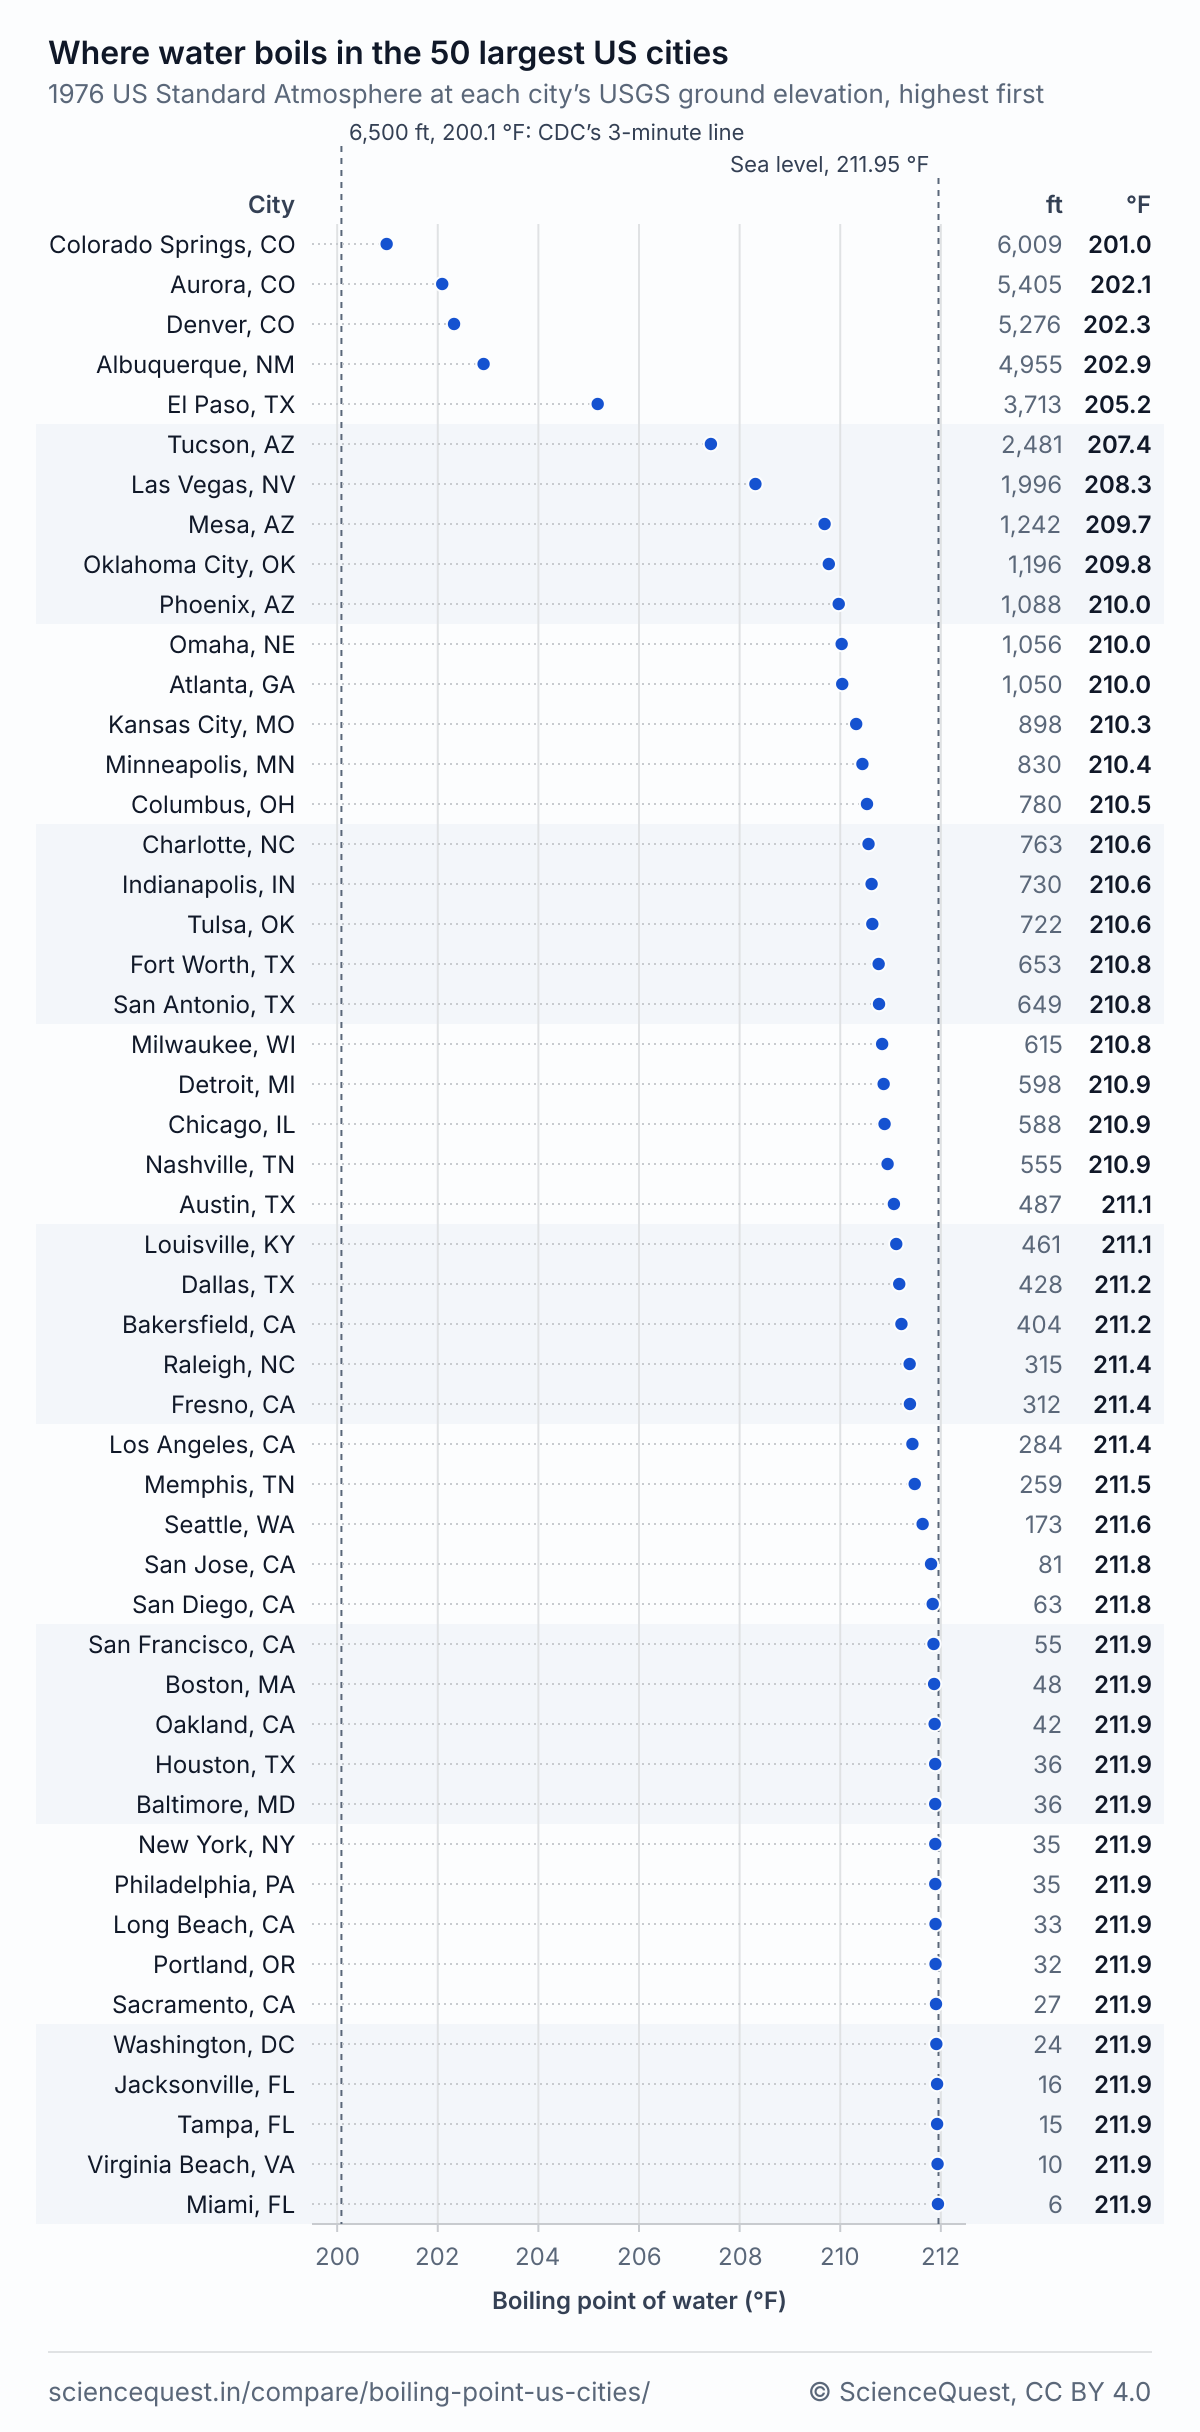
Boiling point of water in each city
| City | State | Size rank | Elevation ft | Elevation m | Pressure psi | Boils at °F | Boils at °C |
|---|---|---|---|---|---|---|---|
| Colorado Springs | CO | 40 | 6,009 | 1,831 | 11.77 | 201.0 | 93.9 |
| Aurora | CO | 50 | 5,405 | 1,647 | 12.04 | 202.1 | 94.5 |
| Denver | CO | 19 | 5,276 | 1,608 | 12.10 | 202.3 | 94.6 |
| Albuquerque | NM | 32 | 4,955 | 1,510 | 12.25 | 202.9 | 95.0 |
| El Paso | TX | 23 | 3,713 | 1,132 | 12.83 | 205.2 | 96.2 |
| Tucson | AZ | 34 | 2,481 | 756 | 13.43 | 207.4 | 97.5 |
| Las Vegas | NV | 24 | 1,996 | 608 | 13.67 | 208.3 | 98.0 |
| Mesa | AZ | 38 | 1,242 | 379 | 14.05 | 209.7 | 98.7 |
| Oklahoma City | OK | 21 | 1,196 | 365 | 14.07 | 209.8 | 98.8 |
| Phoenix | AZ | 5 | 1,088 | 332 | 14.13 | 210.0 | 98.9 |
| Omaha | NE | 42 | 1,056 | 322 | 14.14 | 210.0 | 98.9 |
| Atlanta | GA | 36 | 1,050 | 320 | 14.15 | 210.0 | 98.9 |
| Kansas City | MO | 37 | 898 | 274 | 14.23 | 210.3 | 99.1 |
| Minneapolis | MN | 46 | 830 | 253 | 14.26 | 210.4 | 99.1 |
| Columbus | OH | 15 | 780 | 238 | 14.29 | 210.5 | 99.2 |
| Charlotte | NC | 14 | 763 | 233 | 14.30 | 210.6 | 99.2 |
| Indianapolis | IN | 16 | 730 | 222 | 14.31 | 210.6 | 99.2 |
| Tulsa | OK | 48 | 722 | 220 | 14.32 | 210.6 | 99.2 |
| Fort Worth | TX | 10 | 653 | 199 | 14.35 | 210.8 | 99.3 |
| San Antonio | TX | 7 | 649 | 198 | 14.35 | 210.8 | 99.3 |
| Milwaukee | WI | 31 | 615 | 187 | 14.37 | 210.8 | 99.4 |
| Detroit | MI | 26 | 598 | 182 | 14.38 | 210.9 | 99.4 |
| Chicago | IL | 3 | 588 | 179 | 14.39 | 210.9 | 99.4 |
| Nashville | TN | 20 | 555 | 169 | 14.40 | 210.9 | 99.4 |
| Austin | TX | 12 | 487 | 148 | 14.44 | 211.1 | 99.5 |
| Louisville | KY | 27 | 461 | 140 | 14.45 | 211.1 | 99.5 |
| Dallas | TX | 9 | 428 | 130 | 14.47 | 211.2 | 99.5 |
| Bakersfield | CA | 47 | 404 | 123 | 14.48 | 211.2 | 99.6 |
| Raleigh | NC | 39 | 315 | 96 | 14.53 | 211.4 | 99.7 |
| Fresno | CA | 33 | 312 | 95 | 14.53 | 211.4 | 99.7 |
| Los Angeles | CA | 2 | 284 | 87 | 14.55 | 211.4 | 99.7 |
| Memphis | TN | 29 | 259 | 79 | 14.56 | 211.5 | 99.7 |
| Seattle | WA | 18 | 173 | 53 | 14.60 | 211.6 | 99.8 |
| San Jose | CA | 13 | 81 | 25 | 14.65 | 211.8 | 99.9 |
| San Diego | CA | 8 | 63 | 19 | 14.66 | 211.8 | 99.9 |
| San Francisco | CA | 17 | 55 | 17 | 14.67 | 211.9 | 99.9 |
| Boston | MA | 25 | 48 | 15 | 14.67 | 211.9 | 99.9 |
| Oakland | CA | 45 | 42 | 13 | 14.67 | 211.9 | 99.9 |
| Houston | TX | 4 | 36 | 11 | 14.68 | 211.9 | 99.9 |
| Baltimore | MD | 30 | 36 | 11 | 14.68 | 211.9 | 99.9 |
| New York | NY | 1 | 35 | 11 | 14.68 | 211.9 | 99.9 |
| Philadelphia | PA | 6 | 35 | 11 | 14.68 | 211.9 | 99.9 |
| Long Beach | CA | 44 | 33 | 10 | 14.68 | 211.9 | 99.9 |
| Portland | OR | 28 | 32 | 10 | 14.68 | 211.9 | 99.9 |
| Sacramento | CA | 35 | 27 | 8 | 14.68 | 211.9 | 99.9 |
| Washington | DC | 22 | 24 | 7 | 14.68 | 211.9 | 100.0 |
| Jacksonville | FL | 11 | 16 | 5 | 14.69 | 211.9 | 100.0 |
| Tampa | FL | 49 | 15 | 5 | 14.69 | 211.9 | 100.0 |
| Virginia Beach | VA | 43 | 10 | 3 | 14.69 | 211.9 | 100.0 |
| Miami | FL | 41 | 6 | 2 | 14.69 | 211.9 | 100.0 |
Elevation is the ground at the point the USGS Geographic Names Information System gives for each city, usually its downtown, read from the USGS 3D Elevation Program on 25 October 2026. No city’s GNIS point is above 6,500 ft, so the CDC’s 1-minute boil applies at all 50 points. Parts of Colorado Springs are higher (Peregrine is at 6,855 ft by USGS EPQS), and there the CDC asks for 3 minutes.
The temperatures are the physics of pure water in an average atmosphere, not cooking or food-safety advice. For drinking water, follow the CDC’s steps or your health department’s.
Why the cities differ
Water boils when its vapor pressure reaches the pressure of the air on it. Carry a pot uphill and less air presses on it, so the water reaches that pressure at a lower temperature. In Colorado Springs the standard atmosphere gives 11.77 psi against 14.70 psi at sea level, and water boils at 201.0 °F.
Only 5 of the 50 stand above 3,000 ft, all in Colorado, New Mexico and Texas: Colorado Springs, Aurora, Denver, Albuquerque and El Paso. Another 7 sit between 1,000 and 3,000 ft. The other 38 lie below 1,000 ft, within 2 °F of sea level’s boiling point.
Your stove may sit higher or lower than the city’s point. Every 500 ft of height moves the boiling point about 0.9 °F, so water in a kitchen 500 ft above the city’s point boils about 0.9 °F cooler. Weather moves it too: a change of 1 inch of mercury on the barometer shifts it about 1.7 °F at sea level.
The formulas
- Air pressure, 1976 US Standard Atmosphere [4]
-
- Boiling point, Hyland and Wexler (1983) [5]
-
- Drinking water, CDC [8]
-
z is the ground elevation in m, H the geopotential height and r0 = 6,356,766 m; T is in kelvin, p in kPa and p ws in Pa. Hyland and Wexler’s constants over liquid water (ASHRAE 2017, chapter 1, equation 6): C8 = −5.8002206 × 10³, C9 = 1.3914993, C10 = −4.8640239 × 10⁻², C11 = 4.1764768 × 10⁻⁵, C12 = −1.4452093 × 10⁻⁸, C13 = 6.5459673.
Where each figure holds
| Figure | Based on | Holds for | Not for |
|---|---|---|---|
| City elevation (USGS) | The 3D Elevation Program’s ground model at each city’s GNIS point, read 25 October 2026 | The ground at that one point | The rest of the city: around Denver’s height each 500 ft up or down moves the boiling point about 0.9 °F. Parts of Colorado Springs, such as Peregrine at 6,855 ft, are above 6,500 ft, where the CDC asks for a 3-minute boil |
| US Standard Atmosphere, 1976 | An average atmosphere, the same as the ICAO standard up to 32 km | The average pressure at a height | Today’s weather: each inch of mercury on the barometer moves the boiling point about 2.0 °F at Denver’s pressure and 1.7 °F at sea level |
| Hyland and Wexler (1983) | The saturation pressure of pure water, the formulation ASHRAE uses | Liquid pure water from 0 to 200 °C (273.15 to 473.15 K); the paper’s −100 to 0 °C equation is over ice | Salted or sugared water, which boils hotter |
| CDC boiling time | CDC guidance for making water safe in an emergency | Clear water: a rolling boil for 1 minute, 3 minutes above 6,500 ft | Cloudy water, which the CDC says to let settle or filter first; water that may hold fuel, toxic chemicals or radioactive material, which boiling cannot make safe: use bottled water or another source |
Calculators and simulators
Sources
- U.S. Census Bureau, Population Division (2026). Annual Estimates of the Resident Population for Incorporated Places of 20,000 or More, Ranked by July 1, 2025 Population (SUB-IP-EST2025-ANNRNK), and the dataset sub-est2025.csv. https://www.census.gov/data/tables/time-series/demo/popest/2020s-total-cities-and-towns.html
- U.S. Geological Survey, National Geospatial Program (2026). Geographic Names Information System, Federal Codes file, FedCodes_AllStates_Text.zip (published 2 September 2026): each city’s populated place and its official location, NAD83. https://prd-tnm.s3.amazonaws.com/StagedProducts/GeographicNames/FederalCodes/FedCodes_AllStates_Text.zip
- U.S. Geological Survey. Elevation Point Query Service, version 1: ground elevation from the 3D Elevation Program at a point, in feet or meters. https://epqs.nationalmap.gov/v1/docs
- NOAA, NASA and U.S. Air Force (1976). U.S. Standard Atmosphere, 1976. NASA TM-X-74335. https://ntrs.nasa.gov/citations/19770009539
- Hyland, R. W., and A. Wexler (1983). Formulations for the thermodynamic properties of the saturated phases of H₂O from 173.15 K to 473.15 K. ASHRAE Transactions 89(2A): 500 to 519. https://www.ashrae.org/technical-resources/ashrae-transactions
- ASHRAE (2017). ASHRAE Handbook, Fundamentals (SI), chapter 1, Psychrometrics, equations 5 and 6: Hyland and Wexler’s saturation pressure over ice and over liquid water, with the constants C8 to C13 this page prints. https://www.ashrae.org/technical-resources/ashrae-handbook
- IAPWS (2012). Revised Release on the IAPWS Industrial Formulation 1997 for the Thermodynamic Properties of Water and Steam, R7-97(2012), section 8.2, equation 31, the saturation temperature: an independent check, which agrees with this page’s boiling point at every city within 0.001 °C. https://iapws.org/technical-guidance/release/IF97-Rev
- Centers for Disease Control and Prevention. How to Make Water Safe in an Emergency. https://www.cdc.gov/water-emergency/about/index.html
The values are facts and free to use; this table’s selection and presentation are © 2026 ScienceQuest.