BMR equations compared: Mifflin-St Jeor vs Harris-Benedict vs Katch-McArdle
For a 40-year-old man of 80 kg and 170 cm, the revised Harris-Benedict equation gives 1,749 kcal/day and Mifflin-St Jeor 1,668, 81 lower (4.7 percent). Katch-McArdle at 25 percent body fat gives 1,666. At 130 kg the first two give him 2,419 and 2,168, and a woman of his age and height 2,003 and 2,002.
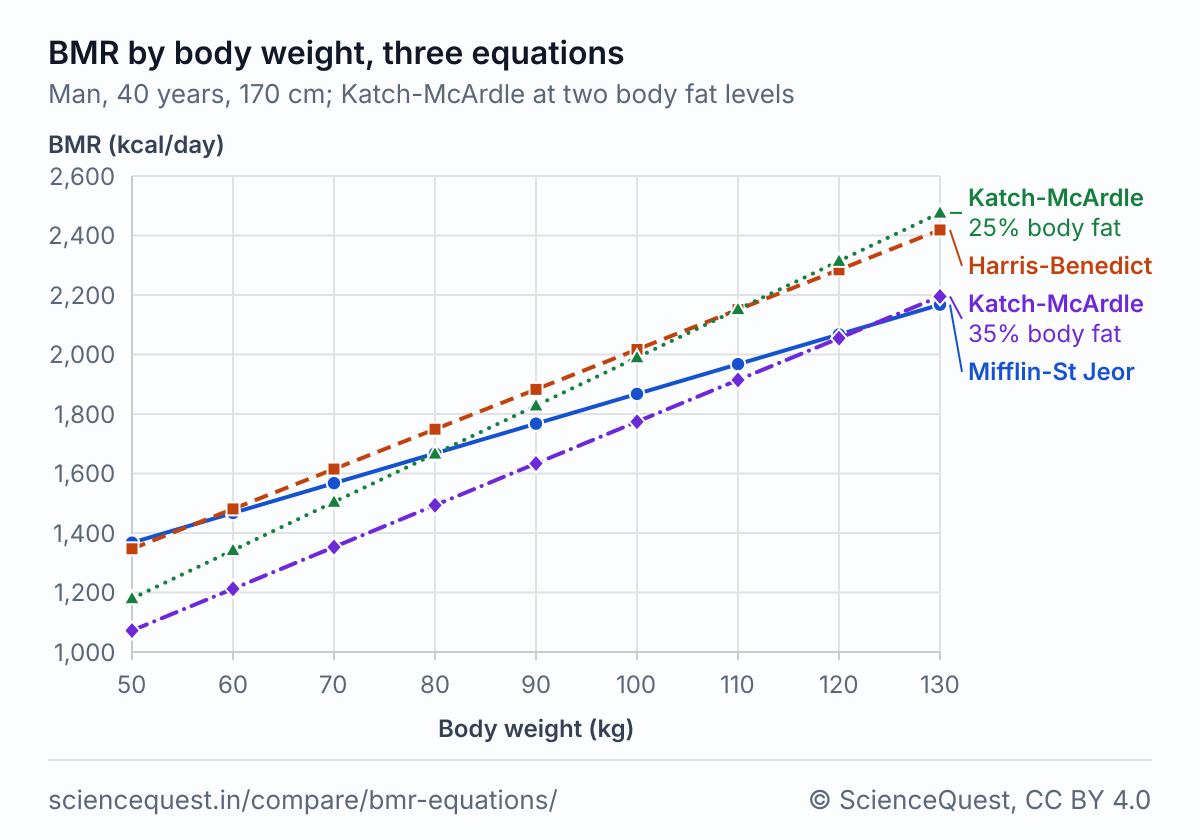
BMR by body weight
| Weight (kg) | Women | Men | Katch-McArdle, either sex | |||
|---|---|---|---|---|---|---|
| Mifflin | Harris-Benedict | Mifflin | Harris-Benedict | 25% fat | 35% fat | |
| 50 | 1,202 | 1,263 | 1,368 | 1,347 | 1,180 | 1,072 |
| 60 | 1,302 | 1,356 | 1,468 | 1,481 | 1,342 | 1,212 |
| 70 | 1,402 | 1,448 | 1,568 | 1,615 | 1,504 | 1,353 |
| 80 | 1,502 | 1,541 | 1,668 | 1,749 | 1,666 | 1,493 |
| 90 | 1,602 | 1,633 | 1,768 | 1,883 | 1,828 | 1,634 |
| 100 | 1,702 | 1,726 | 1,868 | 2,017 | 1,990 | 1,774 |
| 110 | 1,802 | 1,818 | 1,968 | 2,151 | 2,152 | 1,914 |
| 120 | 1,902 | 1,911 | 2,068 | 2,285 | 2,314 | 2,055 |
| 130 | 2,002 | 2,003 | 2,168 | 2,419 | 2,476 | 2,195 |
Whole kcal/day for reading across a row; multiply by 4.184 for kJ/day: 2,000 kcal/day is 8,368 kJ/day. The Katch-McArdle columns keep one body fat at every weight, which few people do.
BMR by age
| Age (years) | Women | Men | ||||
|---|---|---|---|---|---|---|
| Mifflin | Harris-Benedict | Gap | Mifflin | Harris-Benedict | Gap | |
| 20 | 1,502 | 1,535 | +33 | 1,668 | 1,728 | +61 |
| 30 | 1,452 | 1,492 | +40 | 1,618 | 1,672 | +54 |
| 40 | 1,402 | 1,448 | +47 | 1,568 | 1,615 | +47 |
| 50 | 1,352 | 1,405 | +54 | 1,518 | 1,558 | +41 |
| 60 | 1,302 | 1,362 | +60 | 1,468 | 1,501 | +34 |
| 70 | 1,252 | 1,318 | +67 | 1,418 | 1,445 | +27 |
| 80 | 1,202 | 1,275 | +74 | 1,368 | 1,388 | +20 |
We work each gap from the unrounded estimates, so it can differ by 1 from the rounded cells. Mifflin’s sample stopped at 78, so the 80 row lies outside it [1].
BMR by body fat
| Body fat (%) | Lean mass kg | Katch-McArdle kcal/day | Mifflin-St Jeor kcal/day | Katch minus Mifflin kcal/day |
|---|---|---|---|---|
| 10 | 72.0 | 1,925 | 1,743 | +183 |
| 15 | 68.0 | 1,839 | 1,743 | +96 |
| 20 | 64.0 | 1,752 | 1,743 | +10 |
| 25 | 60.0 | 1,666 | 1,743 | −77 |
| 30 | 56.0 | 1,580 | 1,743 | −163 |
| 35 | 52.0 | 1,493 | 1,743 | −249 |
For him Mifflin-St Jeor gives 1,743 and Harris-Benedict 1,816 at any body fat.
All three are population estimates of resting energy expenditure, fitted to groups of measured adults. Your own rate can sit outside every column here; only indirect calorimetry measures it. A 2005 review of Harris-Benedict, Mifflin-St Jeor and two other equations found older adults and US ethnic minorities underrepresented in their development and validation [5].
Why the formulas disagree
Harris and Benedict’s 1918 paper analysed 136 men and 103 women measured over a decade at the Carnegie Nutrition Laboratory [3]. In 1984 Roza and Shizgal refitted the equations with 98 more subjects from a series Benedict published later, which spanned a wider age range [2]. Mifflin’s team measured 498 adults aged 19 to 78, 234 of them obese, and found the original Harris-Benedict equations 5 percent above the REE they measured [1]; the tables here use the 1984 revision. Mifflin and Cunningham fitted resting energy expenditure, which calculators label BMR, while Harris and Benedict measured basal metabolism 12 to 14 hours after the last meal, in complete muscular repose [3].
Each kilogram adds 10 kcal/day in Mifflin-St Jeor, 13.4 in Harris-Benedict for a man and 9.2 for a woman. So at 40 and 170 cm a man’s gap grows 3.4 kcal/day per kg, from −21 at 50 kg to +251 at 130 kg, and a woman’s shrinks 0.75 per kg. Each year of age takes 5.7 kcal/day off a man in Harris-Benedict, 4.3 off a woman and 5 off either in Mifflin-St Jeor, so at 70 kg the men’s gap falls from 61 at 20 to 20 at 80, while the women’s grows from 33 to 74.
Katch-McArdle has no term for sex, age or height; its one input is lean mass, at 21.6 kcal/day per kilogram [4]. Calculators label 370 + 21.6 × lean mass Katch-McArdle, and we cite it to Cunningham’s 1991 review, where the equation appears. For the man in the body fat table it matches Mifflin-St Jeor at 20.6 percent fat, and every 5 points of body fat move it by 86 kcal/day. So a body fat figure 5 points off moves his estimate by more than the 73 kcal/day that separates Harris-Benedict from Mifflin-St Jeor for him.
The formulas
- Mifflin-St Jeor [1]
-
- Harris-Benedict, revised by Roza and Shizgal [2]
-
- Katch-McArdle (Cunningham’s equation) [4]
-
REE is resting energy expenditure in kcal/day, m is weight in kg, h height in cm, a age in years and f body fat in percent; LBM is lean body mass in kg.
Where each formula holds
| Formula | Fitted in | Holds for | Not for |
|---|---|---|---|
| Mifflin-St Jeor | 498 healthy adults aged 19 to 78, 264 of normal weight and 234 obese, REE by indirect calorimetry [1] | Healthy adults of normal weight and with obesity [1]; within 10 percent of measured in more of them than Harris-Benedict or Owen in a 2005 review, which did not test Katch-McArdle [5] | Children, ages outside 19 to 78, and people who are ill, since Mifflin’s sample was healthy [1] |
| Harris-Benedict, revised | Harris and Benedict’s 136 men and 103 women [3], with 98 more from a series Benedict published later [2] | Normally nourished adults, to a stated precision of ±14 percent [2] | Malnourished patients, for whom Roza and Shizgal found it unreliable [2]. Harris and Benedict tabulated the original equations for ages 21 to 70, heights 151 to 200 cm and weights 25.0 to 124.9 kg [3]; the 98 added subjects spanned a wider age range [2] |
| Katch-McArdle (Cunningham) | A review of published studies relating REE to fat-free mass in adults [4] | Adults over a broad range of weights, when fat-free mass is known; it explained 65 to 90 percent of the variation in REE [4] | Anyone without a measured body fat figure, since its error follows the error in that figure; obese women, in whom fat mass may add to the prediction [4] |
Calculators and simulators
Sources
- Mifflin MD, St Jeor ST, Hill LA, Scott BJ, Daugherty SA, Koh YO. A new predictive equation for resting energy expenditure in healthy individuals. Am J Clin Nutr 1990;51(2):241-247. doi:10.1093/ajcn/51.2.241
- Roza AM, Shizgal HM. The Harris Benedict equation reevaluated: resting energy requirements and the body cell mass. Am J Clin Nutr 1984;40(1):168-182. doi:10.1093/ajcn/40.1.168
- Harris JA, Benedict FG. A biometric study of human basal metabolism. Proc Natl Acad Sci USA 1918;4(12):370-373. The original equations and sample. doi:10.1073/pnas.4.12.370
- Cunningham JJ. Body composition as a determinant of energy expenditure: a synthetic review and a proposed general prediction equation. Am J Clin Nutr 1991;54(6):963-969. doi:10.1093/ajcn/54.6.963
- Frankenfield D, Roth-Yousey L, Compher C. Comparison of predictive equations for resting metabolic rate in healthy nonobese and obese adults: a systematic review. J Am Diet Assoc 2005;105(5):775-789. doi:10.1016/j.jada.2005.02.005
The values are facts and free to use; this table’s selection and presentation are © 2026 ScienceQuest.