Wind chill chart in °F and °C, with frostbite risk
At 0 °F in a 15 mph wind the NWS wind chill is −19 °F; at −20 °C and 30 km/h Environment Canada gives −33 °C, High risk: any exposed skin can freeze in 10 to 30 minutes. The two services’ formulas differ by at most 0.056 °C across the 176 metric cells, yet 4 round a degree apart.
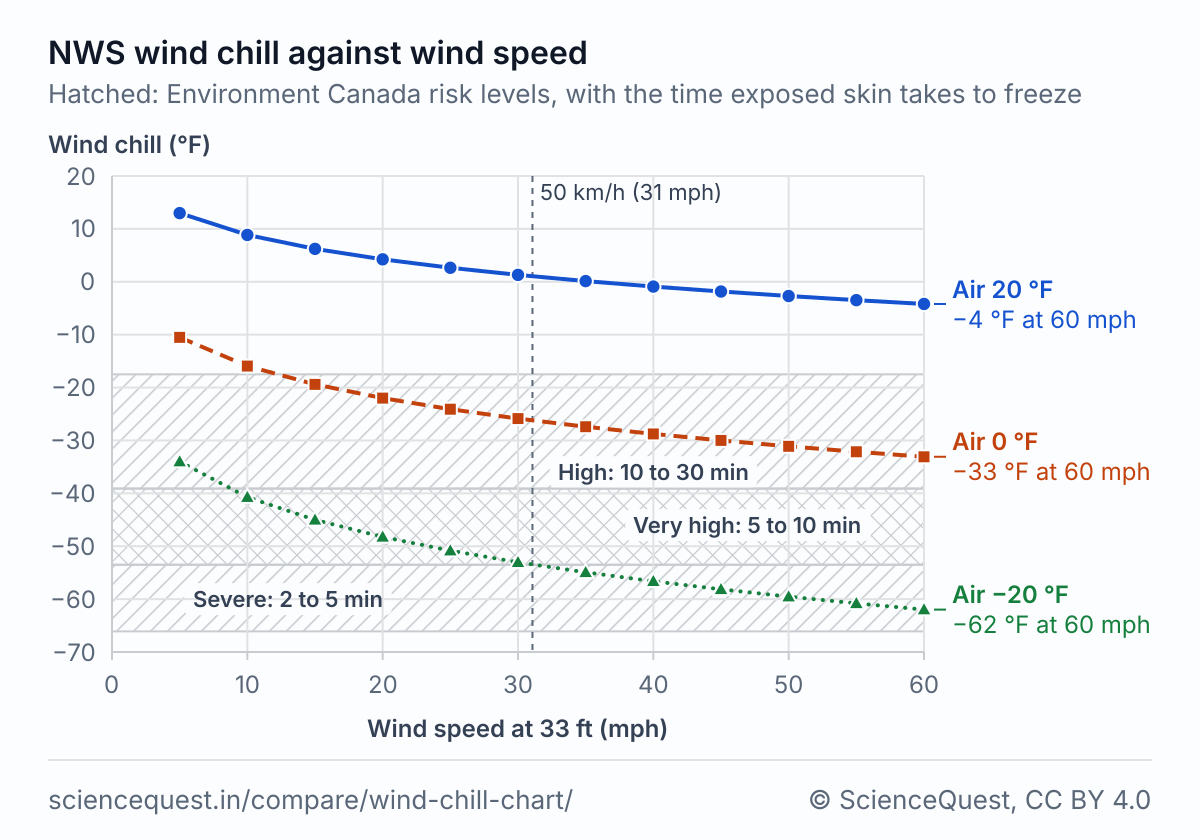
Chart data: wind chill at 20, 0 and −20 °F
| Wind (mph) | Air temperature | ||
|---|---|---|---|
| 20 | 0 | −20 | |
| 5 | 13.0 | −10.5 | −34.0 |
| 10 | 8.9 | −15.9 | −40.7 |
| 15 | 6.2 | −19.4 | −45.0 |
| 20 | 4.2 | −22.0 | −48.2 |
| 25 | 2.6 | −24.1 | −50.8 |
| 30 | 1.3 | −25.9 | −53.0 |
| 35 | 0.1 | −27.4 | −54.9 |
| 40 | −0.9 | −28.8 | −56.6 |
| 45 | −1.8 | −30.0 | −58.1 |
| 50 | −2.7 | −31.1 | −59.5 |
| 55 | −3.5 | −32.1 | −60.8 |
| 60 | −4.2 | −33.1 | −62.0 |
Wind chill chart in °F and mph (NWS formula)
| Wind (mph) | Air temperature (°F) | |||||||||||||||||
|---|---|---|---|---|---|---|---|---|---|---|---|---|---|---|---|---|---|---|
| 40 | 35 | 30 | 25 | 20 | 15 | 10 | 5 | 0 | −5 | −10 | −15 | −20 | −25 | −30 | −35 | −40 | −45 | |
| 5 | 36 | 31 | 25 | 19 | 13 | 7 | 1 | −5 | −11 | −16 | −22 | −28 | −34 | −40 | −46 | −52 | −57 | −63 |
| 10 | 34 | 27 | 21 | 15 | 9 | 3 | −4 | −10 | −16 | −22 | −28 | −35 | −41 | −47 | −53 | −59 | −66 | −72 |
| 15 | 32 | 25 | 19 | 13 | 6 | 0 | −7 | −13 | −19 | −26 | −32 | −39 | −45 | −51 | −58 | −64 | −71 | −77 |
| 20 | 30 | 24 | 17 | 11 | 4 | −2 | −9 | −15 | −22 | −29 | −35 | −42 | −48 | −55 | −61 | −68 | −74 | −81 |
| 25 | 29 | 23 | 16 | 9 | 3 | −4 | −11 | −17 | −24 | −31 | −37 | −44 | −51 | −58 | −64 | −71 | −78 | −84 |
| 30 | 28 | 22 | 15 | 8 | 1 | −5 | −12 | −19 | −26 | −33 | −39 | −46 | −53 | −60 | −67 | −73 | −80 | −87 |
| 35 | 28 | 21 | 14 | 7 | 0 | −7 | −14 | −21 | −27 | −34 | −41 | −48 | −55 | −62 | −69 | −76 | −82 | −89 |
| 40 | 27 | 20 | 13 | 6 | −1 | −8 | −15 | −22 | −29 | −36 | −43 | −50 | −57 | −64 | −71 | −78 | −84 | −91 |
| 45 | 26 | 19 | 12 | 5 | −2 | −9 | −16 | −23 | −30 | −37 | −44 | −51 | −58 | −65 | −72 | −79 | −86 | −93 |
| 50 | 26 | 19 | 12 | 4 | −3 | −10 | −17 | −24 | −31 | −38 | −45 | −52 | −60 | −67 | −74 | −81 | −88 | −95 |
| 55 | 25 | 18 | 11 | 4 | −3 | −11 | −18 | −25 | −32 | −39 | −46 | −54 | −61 | −68 | −75 | −82 | −89 | −97 |
| 60 | 25 | 17 | 10 | 3 | −4 | −11 | −19 | −26 | −33 | −40 | −48 | −55 | −62 | −69 | −76 | −84 | −91 | −98 |
Each cell is the NWS formula rounded to a whole °F, and all 216 match the NWS’s printed chart, effective 1 November 2001 [2]. The NWS defines wind chill only at or below 50 °F with a wind above 3 mph.
Wind chill chart in °C and km/h, with risk levels (Environment Canada)
| Wind (km/h) | Air temperature (°C) | ||||||||||
|---|---|---|---|---|---|---|---|---|---|---|---|
| 0 | −5 | −10 | −15 | −20 | −25 | −30 | −35 | −40 | −45 | −50 | |
| 5 | −2 L | −7 L | −13 M | −19 M | −24 M | −30 H | −36 H | −41 VH | −47 VH | −53 S | −58 E |
| 10 | −3 L | −9 L | −15 M | −21 M | −27 M | −33 H | −39 H | −45 VH | −51 S | −57 E | −63 E |
| 15 | −4 L | −11 M | −17 M | −23 M | −29 H | −35 H | −41 VH | −48 S | −54 S | −60 E | −66 E |
| 20 | −5 L | −12 M | −18 M | −24 M | −30 H | −37 H | −43 VH | −49 S | −56 E | −62 E | −68 E |
| 25 | −6 L | −12 M | −19 M | −25 M | −32 H | −38 H | −44 VH | −51 S | −57 E | −64 E | −70 E |
| 30 | −6 L | −13 M | −20 M | −26 M | −33 H | −39 H | −46 VH | −52 S | −59 E | −65 E | −72 E |
| 35 | −7 L | −14 M | −20 M | −27 M | −33 H | −40 VH | −47 VH | −53 S | −60 E | −66 E | −73 E |
| 40 | −7 L | −14 M | −21 M | −27 M | −34 H | −41 VH | −48 S | −54 S | −61 E | −68 E | −74 E |
| 45 | −8 L | −15 M | −21 M | −28 H | −35 H | −42 VH | −48 S | −55 E | −62 E | −69 E | −75 E |
| 50 | −8 L | −15 M | −22 M | −29 H | −35 H | −42 VH | −49 S | −56 E | −63 E | −69 E | −76 E |
| 55 | −8 L | −15 M | −22 M | −29 H | −36 H | −43 VH | −50 S | −57 E | −63 E | −70 E | −77 E |
| 60 | −9 L | −16 M | −23 M | −30 H | −36 H | −43 VH | −50 S | −57 E | −64 E | −71 E | −78 E |
| 65 | −9 L | −16 M | −23 M | −30 H | −37 H | −44 VH | −51 S | −58 E | −65 E | −72 E | −79 E |
| 70 | −9 L | −16 M | −23 M | −30 H | −37 H | −44 VH | −51 S | −58 E | −65 E | −72 E | −80 E |
| 75 | −10 M | −17 M | −24 M | −31 H | −38 H | −45 VH | −52 S | −59 E | −66 E | −73 E | −80 E |
| 80 | −10 M | −17 M | −24 M | −31 H | −38 H | −45 VH | −52 S | −60 E | −67 E | −74 E | −81 E |
The letters are the risk levels in the key below: L low, M moderate, H high, VH very high, S severe, E extreme. Environment Canada’s printed chart gives −45 at −30 °C and 30 km/h; its formula gives −45.6, which rounds to −46, as here. Its other 65 printed cells match this table [6].
Frostbite risk levels
| Risk level | In the chart | Wind chill °C | Wind chill, rounded °F | What Environment Canada says happens |
|---|---|---|---|---|
| Low | L | 0 to −9 | 32 to 15 | Slight increase in physical discomfort |
| Moderate | M | −10 to −27 | 14 to −17 | Risk of hypothermia and frostbite if outdoors for long periods of time without adequate protection |
| High | H | −28 to −39 | −18 to −39 | Any exposed skin can freeze in 10 to 30 minutes |
| Very high | VH | −40 to −47 | −40 to −53 | Any exposed skin can freeze in 5 to 10 minutes |
| Severe | S | −48 to −54 | −54 to −66 | Exposed skin can freeze in 2 to 5 minutes |
| Extreme | E | −55 or colder | −67 or colder | Exposed skin can freeze in less than 2 minutes |
Environment Canada adds that in sustained winds over 50 km/h (31 mph), frostbite can occur faster than these times.
The risk levels are a guide for planning time outdoors. Follow any cold weather warning the NWS or Environment Canada issues for your area.
Why the formulas disagree
The NWS chart took effect on 1 November 2001 [2], and Environment Canada prints the same index in °C and km/h [5]. Osczevski and Bluestein (2005) describe the model behind both, the heat lost from the upwind side of a head-sized cylinder walking into the wind [4]. Both forms share the 0.6215 term and the 0.16 power. Neither is the other converted: the NWS’s 35.74, 35.75 and 0.4275, converted exactly to °C and km/h, become 13.127, 11.362 and 0.39616, and Environment Canada prints 13.12, 11.37 and 0.3965. That puts the two up to 0.056 °C apart on the metric chart, about 7 times the 0.008 °C that rounding the converted set to four figures would leave.
Each service rounds its wind chill to a whole degree in its own unit. At −10 °C and 30 km/h the NWS form gives −19.49 °C and Environment Canada’s −19.52 °C, so one rounds to −19 and the other to −20. That happens in 4 of the 176 metric cells. At −30 °C and 40 km/h, Environment Canada’s own worked example, the split crosses a risk level: the NWS form gives −47.465 °C, which rounds to −47, Very high risk, and Environment Canada’s gives −47.504 °C, which rounds to −48, Severe risk [6].
The NWS defines wind chill at or below 50 °F with a wind above 3 mph [1]. Environment Canada shows it only at 0 °C or colder, and below 5 km/h it switches to a light wind formula [5], which the metric table does not need because its rows start at 5 km/h. The NWS shades its printed chart at 30, 10 and 5 minutes to frostbite [2]; the levels in these tables are Environment Canada’s [6].
The formulas
Where each formula holds
| Formula | Fitted in | Holds for | Not for |
|---|---|---|---|
| NWS wind chill (°F, mph) | A model of heat lost from the upwind side of a head-sized cylinder walking into the wind, in a steady state [4]; the wind reduced from 33 ft to 5 ft, face height, and no sun [1] | Air at or below 50 °F with wind above 3 mph, measured at 33 ft (10 m); people and animals | Warmer air or calmer wind; objects such as pipes or car radiators, which do not cool below the air temperature; bright sun, which the NWS says can raise the wind chill by 10 to 18 °F |
| Environment Canada formula 1 (°C, km/h) | The same model, with its own four-figure coefficients for °C and km/h | Air at or below 0 °C with wind of 5 km/h or more at 10 m | Wind under 5 km/h, where Environment Canada uses its light wind formula; air above 0 °C, where it shows no wind chill |
| Environment Canada risk levels | Freezing times for exposed skin, by the wind chill in whole °C | Planning time outdoors with skin exposed | Sustained wind over 50 km/h, where frostbite can come faster than the times; covered skin |
Calculators and simulators
Sources
- National Weather Service. Wind Chill Chart. weather.gov, read 25 October 2026. https://www.weather.gov/safety/cold-wind-chill-chart
- National Weather Service. Wind Chill Chart (PDF), effective 1 November 2001, with its frostbite times. https://www.weather.gov/media/safety/windchillchart3.pdf
- National Weather Service El Paso. Wind Chill, from its weather calculator notes (windChill.pdf). https://www.weather.gov/media/epz/wxcalc/windChill.pdf
- Osczevski R, Bluestein M. The new wind chill equivalent temperature chart. Bulletin of the American Meteorological Society 2005;86(10):1453 to 1458. doi:10.1175/BAMS-86-10-1453
- Environment and Climate Change Canada. Climate glossary: Wind Chill, formula 1. climate.weather.gc.ca. https://climate.weather.gc.ca/glossary_e.html
- Government of Canada. Wind chill and the Wind Chill Index: risk levels and chart. canada.ca, modified 16 December 2025. https://www.canada.ca/en/services/environment/weather/severeweather/wind-chill-index.html
The values are facts and free to use; this table’s selection and presentation are © 2026 ScienceQuest.