Dew point chart in °F and °C, with Magnus checked
At 80 °F and 50 percent relative humidity the dew point is 59.7 °F (15.4 °C) on the dew point calculator’s saturation curve. Magnus’s approximation stays within 0.06 °C of that curve wherever the dew point is above freezing. For air saturating below 32 °F, that curve gives the frost point, over ice, above Magnus’s dew point over water.
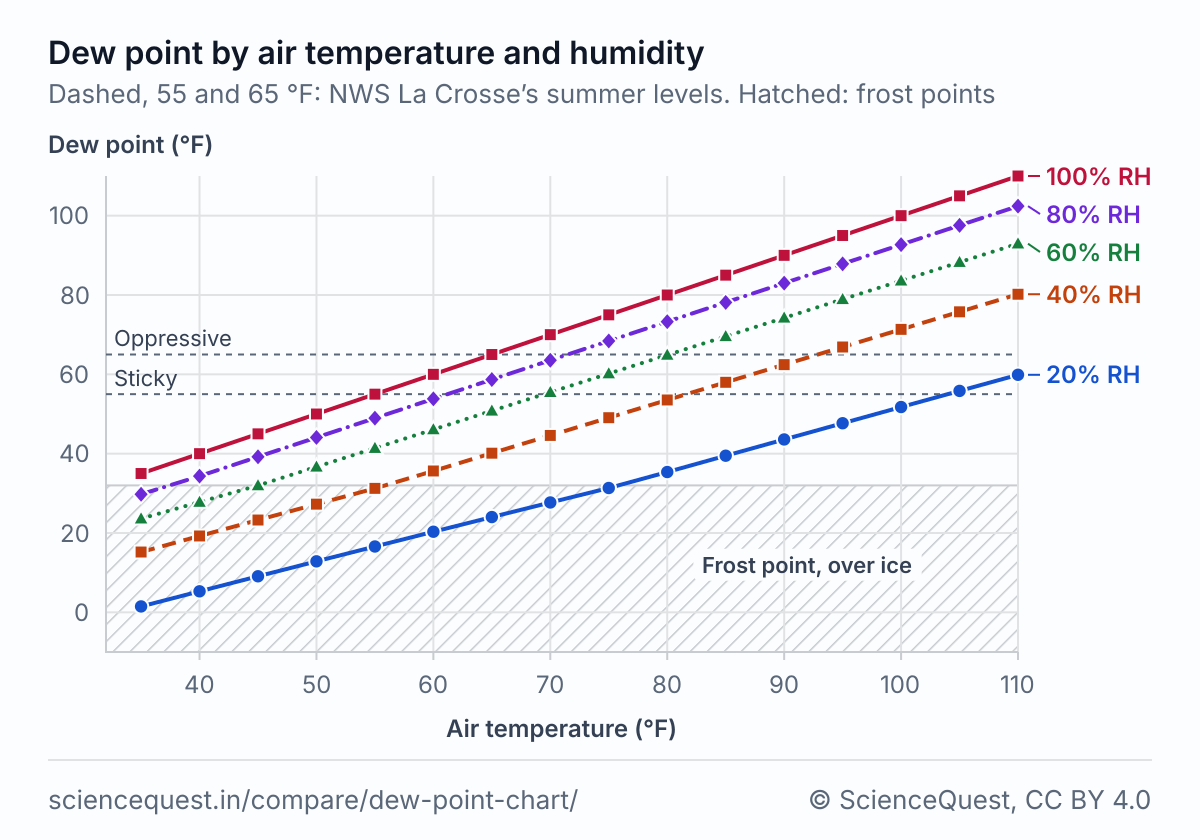
Dew point chart in °F
| Air (°F) | Relative humidity (%) | |||||||||
|---|---|---|---|---|---|---|---|---|---|---|
| 10 | 20 | 30 | 40 | 50 | 60 | 70 | 80 | 90 | 100 | |
| 35 | −11† | 1† | 9† | 15† | 20† | 24† | 27† | 30† | 32 | 35 |
| 40 | −8† | 5† | 13† | 19† | 24† | 28† | 31† | 34 | 37 | 40 |
| 45 | −4† | 9† | 17† | 23† | 28† | 32† | 36 | 39 | 42 | 45 |
| 50 | −1† | 13† | 21† | 27† | 32 | 37 | 41 | 44 | 47 | 50 |
| 55 | 3† | 17† | 25† | 31† | 37 | 41 | 45 | 49 | 52 | 55 |
| 60 | 6† | 20† | 29† | 36 | 41 | 46 | 50 | 54 | 57 | 60 |
| 65 | 10† | 24† | 33 | 40 | 46 | 51 | 55 | 59 | 62 | 65 |
| 70 | 13† | 28† | 37 | 45 | 51 | 55 | 60 | 64 | 67 | 70 |
| 75 | 17† | 31† | 42 | 49 | 55 | 60 | 65 | 68 | 72 | 75 |
| 80 | 20† | 35 | 46 | 54 | 60 | 65 | 69 | 73 | 77 | 80 |
| 85 | 23† | 39 | 50 | 58 | 64 | 70 | 74 | 78 | 82 | 85 |
| 90 | 27† | 44 | 54 | 62 | 69 | 74 | 79 | 83 | 87 | 90 |
| 95 | 30† | 48 | 59 | 67 | 73 | 79 | 84 | 88 | 92 | 95 |
| 100 | 34 | 52 | 63 | 71 | 78 | 84 | 88 | 93 | 97 | 100 |
| 105 | 37 | 56 | 67 | 76 | 83 | 88 | 93 | 98 | 101 | 105 |
| 110 | 41 | 60 | 72 | 80 | 87 | 93 | 98 | 102 | 106 | 110 |
† A frost point. Air this dry saturates over ice before it would over water, so the exact curve gives its frost point, as the dew point calculator does; 42 cells are frost points, among them 32 at 45 °F and 60 percent, which is 31.97 °F before rounding. At 50 °F and 20 percent the frost point is 12.9 °F; Magnus gives 10.5 °F for the dew point over supercooled water.
Dew point chart in °C
| Air (°C) | Relative humidity (%) | |||||||||
|---|---|---|---|---|---|---|---|---|---|---|
| 10 | 20 | 30 | 40 | 50 | 60 | 70 | 80 | 90 | 100 | |
| 0 | −25† | −18† | −14† | −11† | −8† | −6† | −4† | −3† | −1† | 0† |
| 5 | −22† | −14† | −10† | −7† | −4† | −2† | 0† | 2 | 3 | 5 |
| 10 | −18† | −11† | −6† | −3† | 0 | 3 | 5 | 7 | 8 | 10 |
| 15 | −15† | −7† | −2† | 2 | 5 | 7 | 10 | 12 | 13 | 15 |
| 20 | −11† | −3† | 2 | 6 | 9 | 12 | 14 | 16 | 18 | 20 |
| 25 | −8† | 1 | 6 | 10 | 14 | 17 | 19 | 21 | 23 | 25 |
| 30 | −4† | 5 | 11 | 15 | 18 | 21 | 24 | 26 | 28 | 30 |
| 35 | −1† | 9 | 15 | 19 | 23 | 26 | 29 | 31 | 33 | 35 |
| 40 | 3 | 13 | 19 | 24 | 28 | 31 | 33 | 36 | 38 | 40 |
| 45 | 6 | 17 | 23 | 28 | 32 | 35 | 38 | 41 | 43 | 45 |
† A frost point, over ice; 29 cells are. A † on 0 means the answer lies just under the triple point, 0.01 °C.
Magnus against the exact curve
| Air (°C) | 20 percent | 50 percent | 90 percent | |||
|---|---|---|---|---|---|---|
| Exact | Magnus − exact | Exact | Magnus − exact | Exact | Magnus − exact | |
| 0 | −18.23† | −2.11† | −8.16† | −1.03† | −1.27† | −0.17† |
| 10 | −10.64† | −1.33† | 0.06 | −0.02 | 8.44 | 0.00 |
| 20 | −3.21† | −0.45† | 9.27 | −0.01 | 18.31 | 0.00 |
| 30 | 4.61 | −0.02 | 18.45 | 0.00 | 28.18 | 0.00 |
| 40 | 12.78 | +0.01 | 27.59 | +0.02 | 38.04 | +0.01 |
| 50 | 20.88 | +0.05 | 36.69 | +0.05 | 47.89 | +0.01 |
Where the exact figure is a dew point, the widest gap on this page’s three grids is 0.052 °C, at 50 °C and 20 percent. † The exact figure is a frost point, over ice, and Magnus gives the dew point over supercooled water, so the gap is the gap between ice and water: −0.17 °C at 0 °C and 90 percent, −2.11 °C at 0 °C and 20 percent.
Why the formulas disagree
The exact curve is Hyland and Wexler’s saturation pressure [3], in the form ASHRAE prints and PsychroLib codes [4]. “Exact” here means the dew point solved on that curve with no closed-form shortcut; the curve itself is one formulation among several. At RH percent, your air’s vapor pressure is RH/100 times the saturation pressure at its own temperature; the dew point is the temperature at which that much vapor saturates the air. The site finds it by bisection, as the dew point calculator and the psychrometric chart explorer do. Alduchov and Eskridge’s Magnus form [1] writes the saturation pressure as 6.1094 exp[17.625 t / (243.04 + t)] hPa. They chose those constants to stay within 0.384 percent of three standard formulations (Goff and Gratch, Wexler, and Sonntag) from −40 to 50 °C [2]. Solved for td, their form gives the dew point in one line.
Above freezing the two agree to a few hundredths. The widest gap on these grids is 0.052 °C, at 50 °C and 20 percent, and the calculator’s tests hold Magnus within 0.06 °C wherever the dew point is above freezing, for air from 32 to 122 °F (0 to 50 °C). Rounded to whole degrees, Magnus would change one cell of each big table. At 75 °F and 30 percent the exact curve gives 41.501 °F and Magnus 41.468 °F, which round to 42 and 41; at 25 °C and 20 percent they give 0.501 and 0.476 °C, which round to 1 and 0.
Below freezing they part. Cool dry air reaches saturation over ice before it would reach it over supercooled water, and the site’s curve switches to ice at the triple point, 0.01 °C, as PsychroLib does [4]; ASHRAE states the split at 0 °C, and the two equations meet at the triple point. So the exact figures below 32 °F are frost points, marked †, while Magnus with these constants stays over water. At 50 °F and 20 percent the frost point is 12.9 °F and Magnus gives 10.5 °F. In the third table the gap reaches −2.11 °C at 0 °C and 20 percent.
The NWS office in La Crosse rates summer dew points: 55 °F or less feels dry and comfortable, 55 to 65 becomes sticky with muggy evenings, and 65 or more becomes oppressive [5]. Its own example, 80 °F air with a 60 °F dew point at 50 percent, matches the first table, which gives 60 at 80 °F and 50 percent.
The formulas
- Dew point on the exact curve, Hyland and Wexler (1983) [3]
-
- Magnus dew point, Alduchov and Eskridge (1996) [2]
-
θ is a temperature in kelvin and p ws a saturation pressure in Pa; C8 to C13 are Hyland and Wexler’s constants over liquid water, as ASHRAE Handbook Fundamentals (2017) gives them. At or below 0.01 °C the curve takes their constants over ice, C1 to C7, and Td is the frost point. °F = 1.8 × °C + 32.
Where each formula holds
| Formula | Based on | Holds for | Not for |
|---|---|---|---|
| Exact curve (Hyland and Wexler 1983) | Saturation pressure over ice from −100 to 0 °C and over liquid water from 0 to 200 °C, as ASHRAE states them; 173.15 to 473.15 K overall, the range its title gives | Air from 32 to 122 °F (0 to 50 °C), the dew point calculator’s range, with the humidity over water | Air below 32 °F, where a humidity can be quoted over water or over ice. The dew point over supercooled water: below 32 °F it gives the frost point, over ice |
| Magnus (Alduchov and Eskridge 1996) | Three standard formulations over a plane surface of water, −40 to 50 °C, within 0.384 percent | Dew points over water; within 0.06 °C of the exact curve wherever the dew point is above freezing | The frost point: below 32 °F it gives the dew point over supercooled water, which is lower; air above 122 °F (50 °C) |
| NWS La Crosse comfort levels | A forecast office’s general guide | How muggy summer air feels, read from its dew point | Other seasons: the office gives the levels for the summer months |
Calculators and simulators
Related comparisons
Sources
- Alduchov OA, Eskridge RE. Improved Magnus form approximation of saturation vapor pressure. J Appl Meteor 1996;35(4):601 to 609. doi:10.1175/1520-0450(1996)035<0601:IMFAOS>2.0.CO;2, read
- Alduchov OA, Eskridge RE. Improved Magnus’ form of saturation vapor pressure. National Climatic Data Center, NOAA, report OSTI 548871, section 7, equation 25 (AEKR). https://digital.library.unt.edu/ark:/67531/metadc693874/m2/1/high_res_d/548871.pdf, read
- Hyland, R. W., and A. Wexler (1983). Formulations for the thermodynamic properties of the saturated phases of H₂O from 173.15 K to 473.15 K. ASHRAE Transactions 89(2A): 500 to 519. https://www.ashrae.org/technical-resources/ashrae-transactions
- Meyer D, Thevenard D. PsychroLib: a library of psychrometric functions to calculate thermodynamic properties of air. Journal of Open Source Software 2019;4(33):1137. Its saturation pressure is ASHRAE Handbook Fundamentals (2017), chapter 1, equations 5 and 6, with Hyland and Wexler’s constants. doi:10.21105/joss.01137
- National Weather Service La Crosse, WI. Dew Point vs Humidity. weather.gov. https://www.weather.gov/arx/why_dewpoint_vs_humidity, read
The values are facts and free to use; this table’s selection and presentation are © 2026 ScienceQuest.