Heat index vs humidex for the same air
At 32 °C (89.6 °F) and 60 percent humidity, the NWS heat index is 37.1 °C (98.7 °F) and Environment Canada’s humidex is 42.5, 5.4 higher for the same air. At that humidity the humidex stays higher until about 38.1 °C. The heat index passes it there, but from 35.1 °C up the NWS formula is extrapolating past Steadman’s table.
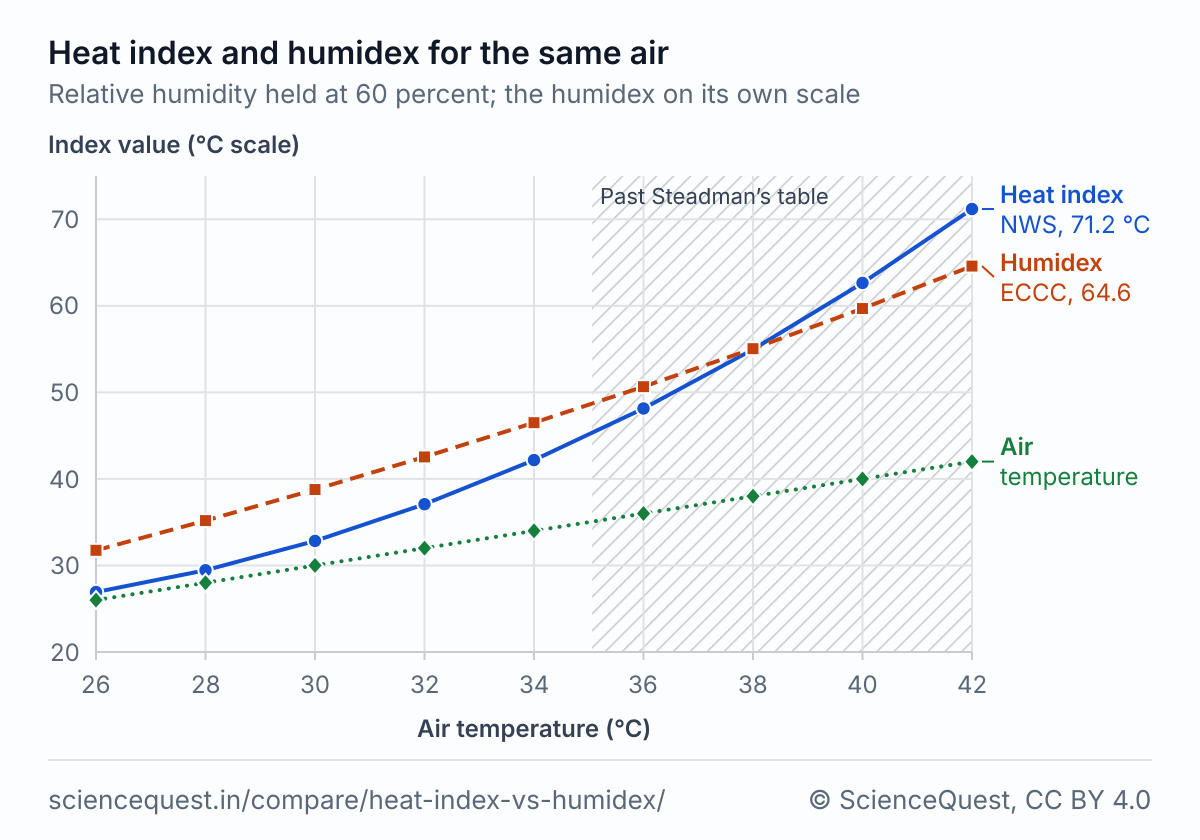
Heat index and humidex at 60 percent humidity
| Air temperature | Heat index °C | Heat index °F | NWS category | Humidex | ECCC comfort | Difference |
|---|---|---|---|---|---|---|
| 26 °C (78.8 °F) | 26.9 | 80.5 | Caution | 31.7 | Some discomfort | +4.8 |
| 28 °C (82.4 °F) | 29.4 | 85.0 | Caution | 35.2 | Some discomfort | +5.8 |
| 30 °C (86.0 °F) | 32.8 | 91.1 | Extreme Caution | 38.8 | Some discomfort | +6.0 |
| 32 °C (89.6 °F) | 37.1 | 98.7 | Extreme Caution | 42.5 | Great discomfort | +5.4 |
| 34 °C (93.2 °F) | 42.2 | 107.9 | Danger | 46.5 | Dangerous | +4.3 |
| 36 °C (96.8 °F) | 48.1† | 118.6† | Danger | 50.7 | Dangerous | +2.6 |
| 38 °C (100.4 °F) | 55.0† | 130.9† | Extreme Danger | 55.0 | Dangerous | 0.0 |
| 40 °C (104.0 °F) | 62.6† | 144.8† | Extreme Danger | 59.7 | Dangerous | −2.9 |
| 42 °C (107.6 °F) | 71.2† | 160.1† | Extreme Danger | 64.6 | Dangerous | −6.6 |
Difference: the humidex minus the heat index in °C, between the printed values. Environment Canada works the humidex from the dew point. The dew points, from the humidity by Hyland and Wexler’s saturation pressure as the dew point calculator finds them, run from 17.6 °C at 26 °C to 32.6 °C at 42 °C. At 26 °C the simple formula gives 79.2 °F. The NWS calculator runs the regression above 79 °F, as this table does; by the equation page’s 80 °F the cell would read 79.2 °F (26.2 °C), with no category. Environment Canada adds “avoid exertion” to great discomfort and “possible heat stroke” to dangerous. † Past the edge of Steadman’s table, which at 60 percent is 35.1 °C: the NWS number is its regression extrapolated.
The same air at 40, 60 and 80 percent
| Air temperature | 40 percent humidity | 60 percent humidity | 80 percent humidity | |||
|---|---|---|---|---|---|---|
| Heat index °C | Humidex | Heat index °C | Humidex | Heat index °C | Humidex | |
| 26 °C (78.8 °F) | 25.7 | 27.9 | 26.9 | 31.7 | 27.7 | 35.6 |
| 28 °C (82.4 °F) | 27.7 | 30.9 | 29.4 | 35.2 | 32.1 | 39.5 |
| 30 °C (86.0 °F) | 29.7 | 33.9 | 32.8 | 38.8 | 37.7 | 43.7 |
| 32 °C (89.6 °F) | 32.3 | 37.1 | 37.1 | 42.5 | 44.4† | 48.0 |
| 34 °C (93.2 °F) | 35.4 | 40.4 | 42.2 | 46.5 | 52.2† | 52.7 |
| 36 °C (96.8 °F) | 39.1 | 43.8 | 48.1† | 50.7 | 61.2† | 57.6 |
| 38 °C (100.4 °F) | 43.4 | 47.4 | 55.0† | 55.0 | 71.3† | 62.8 |
| 40 °C (104.0 °F) | 48.3 | 51.1 | 62.6† | 59.7 | 82.5† | 68.4 |
† Past the edge of Steadman’s table, which falls at 31.1 °C at 80 percent and 35.1 °C at 60 percent; at 40 percent it falls at 40.5 °C, beyond the last row. Environment Canada’s own Tables 2 and 3 print the same whole numbers in 19 of the 21 humidexes they share with this table; at 28 °C and 80 percent they print 39, against 39.5 here, and at 32 °C and 60 percent they print 42, against 42.5 here.
Where each agency’s warning starts
| Relative humidity | Air temperature where it starts | At the NWS line | ||
|---|---|---|---|---|
| NWS Danger °C | Great discomfort °C | Dangerous °C | Humidex | |
| 30 percent | 38.0 | 35.4 | 39.2 | 43.6 |
| 40 percent | 36.1 | 33.5 | 37.0 | 44.1 |
| 50 percent | 34.5 | 31.8 | 35.1 | 44.3 |
| 60 percent | 33.0 | 30.4 | 33.5 | 44.4 |
| 70 percent | 31.7 | 29.1 | 32.1 | 44.6 |
| 80 percent | 30.6 | 28.0 | 30.9 | 44.9 |
| 90 percent | 29.6† | 27.0 | 29.7 | 45.3 |
NWS Danger starts at a heat index of 103 °F; Environment Canada’s great discomfort at a humidex of 40 and dangerous at 46. Environment Canada’s tables print the humidex as a whole number, so 39.5 counts as 40 and 45.5 as 46, as in the first table’s comfort column. The last column is the humidex of the air at the NWS line. † That line lies past the edge of Steadman’s table, so the 103 °F comes from the extrapolated regression.
Follow your local heat warning, which may use either index or another. This page compares two formulas and gives no safety advice.
Why the formulas disagree
The heat index starts from a model of one person. Rothfusz fitted the NWS regression to Steadman’s 1979 table of apparent temperatures, and that table assumes an adult 5 ft 7 in tall and 147 pounds, in long trousers and a short-sleeved shirt, walking at 3.1 mph in a 5 knot wind, in shade. Environment Canada’s humidex (Masterton and Richardson, 1979) has no body model: it adds 0.5555 to the air temperature for every hPa of vapour pressure above 10 hPa, the vapour pressure of air with a dew point of 7.0 °C.
At 60 percent and 26 °C the humidex reads 5.7 above the air and the heat index 0.9. From 34 to 42 °C the heat index climbs faster, from 42.2 to 71.2 °C, while the humidex goes from 46.5 to 64.6.
Most of that climb sits past 35.1 °C at 60 percent, where Steadman’s model gives no answer. Lu and Romps (2022) showed that it turns unphysical in air that hot and humid, and the NWS says its regression is not valid beyond the range of Steadman’s data. The NWS calculator prints a number there by extending the fit past its data, so the crossing near 38.1 °C comes from that extrapolation. Each agency warns on its own scale. At 60 percent the NWS reaches Danger, 103 °F, at 33.0 °C, where the humidex reads 44.4, great discomfort; Environment Canada’s dangerous band starts at 33.5 °C.
The formulas
- NWS simple formula, used while it gives 79 °F or less [2]
-
- Rothfusz regression, when the simple formula gives more than 79 °F [3]
-
- Humidex [6]
-
- Dew point from the relative humidity, Hyland and Wexler (1983) [9]
-
θ is a temperature in kelvin and p ws a saturation pressure in Pa; C8 to C13 are Hyland and Wexler’s constants over liquid water, as ASHRAE Handbook Fundamentals (2017) gives them.
Where each formula holds
| Formula | Fitted in | Holds for | Not for |
|---|---|---|---|
| NWS heat index (Rothfusz 1990, on Steadman 1979) | Steadman’s table, which ends at the edge of his model in hot, humid air (31.1 °C at 80 percent, Lu and Romps 2022), for one adult walking in shade in a 5 knot wind | A heat index of about 80 °F (26.7 °C) or more inside Steadman’s table, to ±1.3 °F | Full sunshine, which the NWS says can add up to 15 °F; air past Steadman’s edge, 35.1 °C at 60 percent, where the fit extrapolates |
| Humidex (Environment Canada) | A vapour pressure from the dew point, then 0.5555 per hPa above 10 hPa added to the air temperature | Air of 20 °C or more with a humidex at least 1 above it, the hours Environment Canada reports | Air below 20 °C; reading the number as °F, or against the NWS categories |
Calculators and simulators
Sources
- NOAA National Weather Service, Weather Prediction Center. The Heat Index Equation. https://www.wpc.ncep.noaa.gov/html/heatindex_equation.shtml
- NOAA National Weather Service, Weather Prediction Center. Heat Index Calculator. https://www.wpc.ncep.noaa.gov/html/heatindex.shtml
- Rothfusz LP. The heat index “equation” (or, more than you ever wanted to know about heat index). NWS Southern Region Technical Attachment SR 90-23, 1 July 1990. https://www.weather.gov/media/ffc/ta_htindx.PDF
- Steadman RG. The assessment of sultriness. Part I: A temperature-humidity index based on human physiology and clothing science. J Appl Meteor 1979;18(7):861 to 873. doi:10.1175/1520-0450(1979)018<0861:TAOSPI>2.0.CO;2
- NOAA National Weather Service, Amarillo. What is the heat index? https://www.weather.gov/ama/heatindex
- Environment and Climate Change Canada. Climate glossary: Humidex. https://climate.weather.gc.ca/glossary_e.html
- Government of Canada. How to use the Humidex. Table 1: Reference legend for Humidex range and degree of comfort; Tables 2 and 3: Humidex for relative humidity from 100% to 65% and from 60% to 20%. https://www.canada.ca/en/services/environment/weather/severeweather/humidex.html
- Lu Y-C, Romps DM. Extending the heat index. J Appl Meteor Climatol 2022;61(10):1367 to 1383. doi:10.1175/JAMC-D-22-0021.1
- Hyland, R. W., and A. Wexler (1983). Formulations for the thermodynamic properties of the saturated phases of H2O from 173.15 K to 473.15 K. ASHRAE Transactions 89(2A): 500 to 519. https://www.ashrae.org/technical-resources/ashrae-transactions
The values are facts and free to use; this table’s selection and presentation are © 2026 ScienceQuest.