Navy body fat chart: the 1984 Hodgdon-Beckett equations vs the DoD 2002 tape test form
For a man 70 in tall with a 36 in abdomen and a 16 in neck, the 1984 Navy equation gives 19.3% body fat and the DoD 2002 tape test form 19.4%. Across abdomen minus neck values from 16 to 32 in they differ by 0.32 points at most; for a woman 64 in tall, by 0.27.
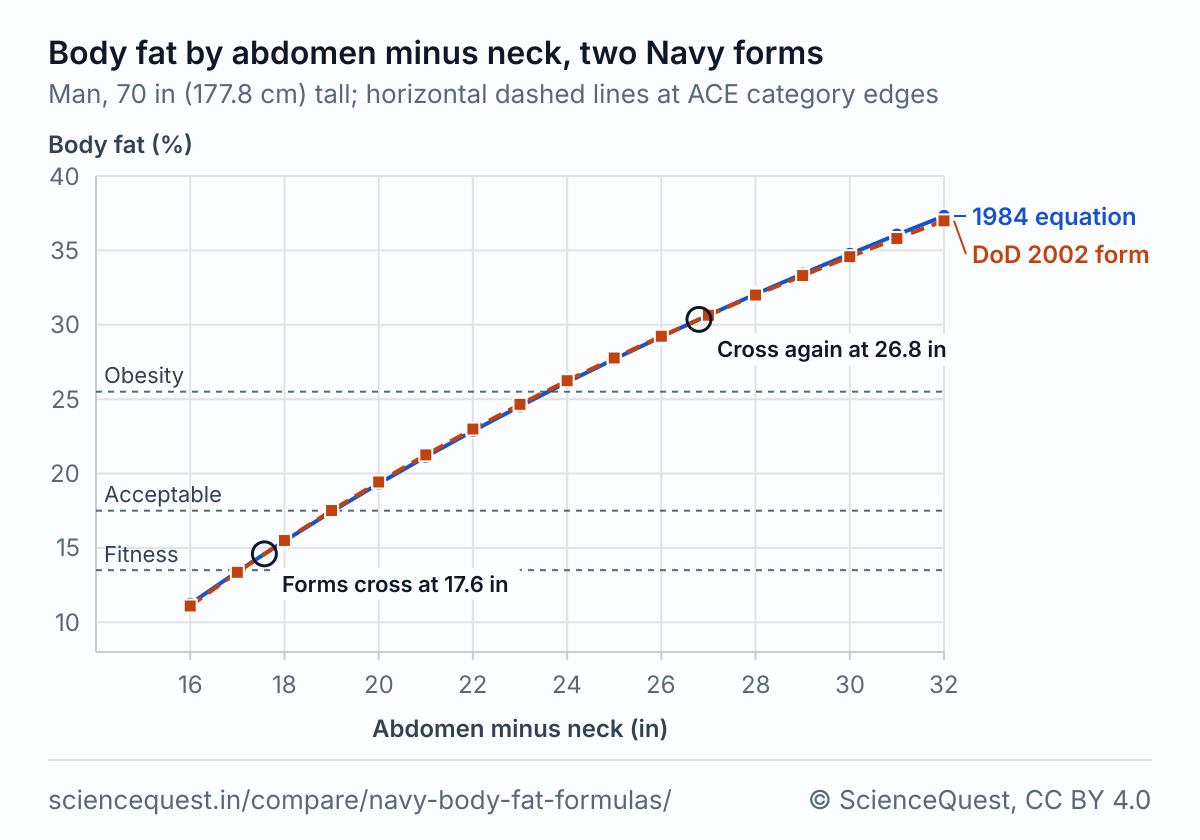
1984 equation vs DoD 2002 form, man 70 in tall
| Abdomen minus neck (in) | Body fat | ACE category | |||
|---|---|---|---|---|---|
| 1984 % | DoD 2002 % | Gap points | 1984 | DoD 2002 | |
| 16 | 11.2 | 11.1 | −0.14 | Athletes | Athletes |
| 17 | 13.4 | 13.4 | −0.04 | Athletes | Athletes |
| 18 | 15.5 | 15.5 | +0.03 | Fitness | Fitness |
| 19 | 17.4 | 17.5 | +0.08 | Fitness | Acceptable |
| 20 | 19.3 | 19.4 | +0.11 | Acceptable | Acceptable |
| 21 | 21.1 | 21.3 | +0.13 | Acceptable | Acceptable |
| 22 | 22.9 | 23.0 | +0.13 | Acceptable | Acceptable |
| 23 | 24.5 | 24.6 | +0.12 | Not in a band | Not in a band |
| 24 | 26.1 | 26.2 | +0.10 | Obesity | Obesity |
| 25 | 27.7 | 27.8 | +0.07 | Obesity | Obesity |
| 26 | 29.2 | 29.2 | +0.04 | Obesity | Obesity |
| 27 | 30.6 | 30.6 | −0.01 | Obesity | Obesity |
| 28 | 32.1 | 32.0 | −0.06 | Obesity | Obesity |
| 29 | 33.4 | 33.3 | −0.12 | Obesity | Obesity |
| 30 | 34.8 | 34.6 | −0.18 | Obesity | Obesity |
| 31 | 36.1 | 35.8 | −0.25 | Obesity | Obesity |
| 32 | 37.3 | 37.0 | −0.32 | Obesity | Obesity |
We work the gap from the unrounded estimates and read each category at the nearest whole percent, because ACE’s chart lists whole percents; “Not in a band” is 25, which falls between acceptable (18 to 24) and obesity (over 25) [7].
Navy body fat chart for men (DoD 2002 form)
| Abdomen minus neck (in) | Height (in) | ||||||
|---|---|---|---|---|---|---|---|
| 64 | 66 | 68 | 70 | 72 | 74 | 76 | |
| 17 | 16 | 15 | 14 | 13 | 13 | 12 | 11 |
| 18 | 18 | 17 | 16 | 15 | 15 | 14 | 13 |
| 19 | 20 | 19 | 18 | 18 | 17 | 16 | 15 |
| 20 | 22 | 21 | 20 | 19 | 19 | 18 | 17 |
| 21 | 24 | 23 | 22 | 21 | 20 | 20 | 19 |
| 22 | 26 | 25 | 24 | 23 | 22 | 21 | 20 |
| 23 | 27 | 26 | 26 | 25 | 24 | 23 | 22 |
| 24 | 29 | 28 | 27 | 26 | 25 | 25 | 24 |
| 25 | 30 | 30 | 29 | 28 | 27 | 26 | 25 |
| 26 | 32 | 31 | 30 | 29 | 28 | 28 | 27 |
| 27 | 33 | 32 | 32 | 31 | 30 | 29 | 28 |
| 28 | 35 | 34 | 33 | 32 | 31 | 30 | 29 |
| 29 | 36 | 35 | 34 | 33 | 32 | 32 | 31 |
DoD’s own Table E3.T1 prints the same form for men 60 to 79.5 in tall but leaves a cell blank where it gives under 9 or over 37 percent; every cell here is one it prints. Enclosure 3 says to round to an integer “erring on the side of the Service member,” but its tables round to the nearest whole percent, as these cells do [4]. Rounded the same way, the 1984 equation gives a different whole percent in 7 of these 91 cells.
Navy body fat chart for women (DoD 2002 form)
| Waist + hip − neck (in) | Height (in) | |||||
|---|---|---|---|---|---|---|
| 60 | 62 | 64 | 66 | 68 | 70 | |
| 52 | 28 | 27 | 25 | 24 | 23 | 21 |
| 54 | 31 | 29 | 28 | 27 | 25 | 24 |
| 56 | 33 | 32 | 30 | 29 | 28 | 27 |
| 58 | 36 | 34 | 33 | 32 | 30 | 29 |
| 60 | 38 | 37 | 35 | 34 | 33 | 32 |
| 62 | 40 | 39 | 38 | 36 | 35 | 34 |
| 64 | 43 | 41 | 40 | 39 | 37 | 36 |
| 66 | 45 | 43 | 42 | 41 | 40 | 38 |
| 68 | 47 | 46 | 44 | 43 | 42 | 40 |
DoD’s Table E3.T2 prints the same form for women 58 to 77.5 in tall, rounded to the nearest whole percent, and leaves a cell blank where it gives under 19 or over 47 percent [4]; every cell here is one it prints. Rounded the same way, the 1984 equation gives a different whole percent in 12 of these 54 cells.
1984 equation vs DoD 2002 form, woman 64 in tall
| Waist + hip − neck (in) | Body fat | ACE category | |||
|---|---|---|---|---|---|
| 1984 % | DoD 2002 % | Gap points | 1984 | DoD 2002 | |
| 50 | 22.3 | 22.5 | +0.13 | Fitness | Fitness |
| 52 | 25.0 | 25.2 | +0.21 | Acceptable | Acceptable |
| 54 | 27.7 | 27.9 | +0.26 | Acceptable | Acceptable |
| 56 | 30.2 | 30.5 | +0.27 | Acceptable | Acceptable |
| 58 | 32.7 | 33.0 | +0.26 | Obesity | Obesity |
| 60 | 35.2 | 35.4 | +0.23 | Obesity | Obesity |
| 62 | 37.5 | 37.7 | +0.17 | Obesity | Obesity |
| 64 | 39.9 | 40.0 | +0.09 | Obesity | Obesity |
| 66 | 42.1 | 42.1 | −0.01 | Obesity | Obesity |
| 68 | 44.4 | 44.3 | −0.12 | Obesity | Obesity |
| 70 | 46.6 | 46.3 | −0.25 | Obesity | Obesity |
The two forms put her in the same ACE category on every row; the widest gap is +0.27 points, at 56 in.
Both forms estimate body fat from a tape measure and a height, fitted to the Navy personnel the 1984 reports weighed underwater. The reports put the 1984 equations’ standard error at 3.52 points for men and 3.72 for women [1][2], several times the gap between the two forms, so a reading near a category edge could belong to the category on either side.
Why the formulas disagree
Hodgdon and Beckett measured 602 Navy men aged 18 to 56 [1] and 214 Navy women aged 18 to 44 [2], weighed each one underwater for body density, and ran a stepwise regression on the logarithms of their circumferences and height in cm. They predicted body density and turned it into percent fat with Siri’s 495 / density − 450 [3]. In the men’s equation they combined abdomen and neck into one value before taking the logarithm, because one circumference value made two-way field tables easier to print [1].
DoD Instruction 1308.3 prints percent fat in one step, in inches, and says its look-up tables derive from the two 1984 reports [4]. You can’t get its coefficients by converting the units. Siri’s step makes the 1984 estimate curve against the logarithm of the circumference value, and the DoD form is a straight line in it, so the two can meet at two points at most. For a man of 70 in they meet at both, near 17.6 and 26.8 in. Between those values the DoD form reads higher, by up to 0.13 points at 22 in; outside them it reads lower, by 0.14 at 16 in and 0.32 at 32 in. At 19 in, 0.08 points is enough to move him from fitness to acceptable: the 1984 equation gives 17.4 and the DoD form 17.5.
Both forms need only a tape measure and a height, where skinfold equations such as Jackson and Pollock’s need calipers and a BMI-based estimate such as Deurenberg’s needs a weight. DoD canceled the 2002 Instruction in 2022; its replacement prints no equation and lets each service judge body composition by a body fat calculation, waist-to-height ratio, abdominal circumference or a height and weight screen [5]. The August 2026 reissue screens first by waist-to-height ratio, with 0.55 as the upper limit, and calculates body fat only for members at or over their service’s limit [6].
The formulas
- Hodgdon and Beckett 1984, men (cm) [1]
-
- Hodgdon and Beckett 1984, women (cm) [2]
-
- Siri 1961, density to percent fat [3]
-
- DoD 2002, men (inches) [4]
-
- DoD 2002, women (inches) [4]
-
D is body density in g/mL; a is the abdomen at the navel, w the waist at its narrowest, p the hip at the buttocks’ widest, n the neck just below the larynx and h height, in cm in the 1984 equations and in inches in the DoD form.
Where each formula holds
| Formula | Fitted in | Holds for | Not for |
|---|---|---|---|
| 1984 equation, men | 602 male Navy personnel aged 18 to 56 (mean 31.9), 176.8 ± 6.96 cm tall with 21.60 ± 8.08 percent fat (mean ± SD), body density by underwater weighing; R = 0.90, standard error 0.00791 g/cc, which the report gives as 3.52 points of fat [1] | Adult men like the sample, with the abdomen measured at the navel and the neck just below the larynx; on 100 more Navy men measured by another laboratory it correlated 0.90 with underwater weighing, standard error 2.70 points [1] | Boys, men older than 56, and a tape put anywhere but the report’s sites [1] |
| 1984 equation, women | 214 female Navy personnel aged 18 to 44 (mean 26.5), 164.5 ± 6.58 cm tall with 27.04 ± 6.85 percent fat (mean ± SD), body density by underwater weighing; R = 0.85, standard error 0.00796 g/cc, 3.72 points of fat [2] | Adult women like the sample, with the waist at its narrowest, the hip at the buttocks’ widest and the neck below the larynx; standard errors of 4.36 points on 66 Canadian Forces women and 4.04 on 80 Navy women in cross-validation [2] | Girls and women older than 44, outside the sample [2] |
| DoD 2002 inch form | No sample of its own: DoD derives its tables from the two 1984 reports [4] | Service members taped in inches as enclosure 3 directs: men 60 to 79.5 in tall with abdomen minus neck 13.5 to 35 in, women 58 to 77.5 in tall with waist plus hip minus neck 45 to 79.5 in. The tables print results only from 9 to 37 percent for men and 19 to 47 for women, rounded to the nearest whole percent, though the text says to round “erring on the side of the Service member” [4] | A body outside those tables; a figure finer than a whole percent, which DoD says implies greater precision than the estimate has [4]; and today’s military standards, since DoD canceled the Instruction in 2022 [5] |
Calculators and simulators
Related comparisons
Sources
- Hodgdon JA, Beckett MB. Prediction of percent body fat for U.S. Navy men from body circumferences and height. Report No. 84-11. San Diego, CA: Naval Health Research Center; March 1984. DTIC accession AD-A143 890. doi:10.21236/ADA143890
- Hodgdon JA, Beckett MB. Prediction of percent body fat for U.S. Navy women from body circumferences and height. Report No. 84-29. San Diego, CA: Naval Health Research Center; June 1984. DTIC accession AD-A146 456. doi:10.21236/ADA146456
- Siri WE. Body composition from fluid spaces and density: analysis of methods. In: Brozek J, Henschel A, eds. Techniques for Measuring Body Composition. Washington, DC: National Academy of Sciences, National Research Council; 1961:223-244. Reprinted in Nutrition 1993;9(5):480-491. https://pubmed.ncbi.nlm.nih.gov/8286893/
- US Department of Defense. DoD Instruction 1308.3, DoD Physical Fitness and Body Fat Programs Procedures. , enclosure 3, Body Fat Assessment Procedures, with Tables E3.T1 and E3.T2. Canceled . Archived copy. https://web.archive.org/web/20210318211445/https://www.esd.whs.mil/Portals/54/Documents/DD/issuances/dodi/130803p.pdf
- US Department of Defense. DoD Instruction 1308.03, DoD Physical Fitness/Body Composition Program. , paragraph 3.2.f.(2). Archived copy. https://web.archive.org/web/20220317162204/https://www.esd.whs.mil/portals/54/documents/dd/issuances/dodi/130803p.pdf
- US Department of War. DoW Instruction 1308.03, DoW Physical Fitness/Body Composition Program. , paragraph 3.2.g. Archived copy. https://web.archive.org/web/20261011162013/https://www.esd.whs.mil/Portals/54/Documents/DD/issuances/dodi/130803p.pdf
- American Council on Exercise. Percent Body Fat Norms for Men and Women, on the Percent Body Fat Calculator page. acefitness.org, archived . https://web.archive.org/web/20231201104650/https://www.acefitness.org/resources/everyone/tools-calculators/percent-body-fat-calculator/
The values are facts and free to use; this table’s selection and presentation are © 2026 ScienceQuest.